Tag Archives: power generation

Seven Years On

The last seven year have seen too little progress on solving the climate change problem, despite some welcome developments.  Much more rapid progress is now needed.

It is now seven years since I started this blog – my first post was on 3rd March 2013.  It seems a good time to take a look at what has gone well and what has gone badly over that period in efforts to reduce climate change.  So here are seven ways in which things have gone badly, and seven ways in which they have gone well.

Things that have gone badly over the last seven years

  1. Annual CO2 emissions from energy and industry have increased over the last seven years, continuing the long-term trend, when they need to be decreasing rapidly.

Chart 1: Emissions of CO2 from energy and industry (excluding land use)

Source: EDGAR  https://edgar.jrc.ec.europa.eu/booklet2019/Fossil_CO2andGHG_emissions_of_all_world_countries_booklet_2019report.pdf

  1. Deforestation has not fallen – if anything it’s increased.

This not only bad for the climate, it’s bad for biodiversity and the wider stability of ecosystems.

Chart 2: Tropical primary forest loss (million hectares)

See:  https://www.bbc.co.uk/news/science-environment-48104037

  1. Over 15% of the remaining carbon budget has been used since 2013, even on the most optimistic view[i].

In 2013 the remaining carbon budget (that is, total cumulative CO2 emissions that remain possible while limiting global mean surface temperature rises to 2 degrees) was around 1900Gt CO2.  It is now around 1600Gt CO2.The remainder is getting used up ever more quickly as emissions continue to rise.

  1. Large amounts of high carbon infrastructure are still being built.

This includes large amounts of new coal-fuelled power generation. This risks lock-in of emissions for decades.

  1. There is a lack of progress with developing and implementing low carbon technologies in many sectors

Most emissions intensive industries, notably steel, have made little progress in changing their processes to reduce emissions.  One of the main technologies likely to be needed for decarbonising industrial emissions, CCS, has seen very little deployment, with only about an additional 10 mtpa[ii] stored from projects coming on line since 2013.  The largest contributor to the increase has been the Gorgan project, which is natural gas production, so not likely to be part of a net zero emissions world.  10 mtpa is only about 0.02% of global emissions.  CCS is also likely to be essential for achieving negative emissions from Bioenergy with CCS (BECCS), among other things.  There has also been only very limited progress to date on deploying low carbon hydrogen.

  1. China appears to be making emissions reduction less of a priority.

Among other factors, recently slowing economic growth seems to have focussed attention in China towards economic stability and energy security rather than the threats from climate change.

  1. Most countries have targets that are far too weak

Existing pledges under the Paris Agreement imply a continuing increase in global emissions rather than the rapid decrease that is needed[iii].

This is a daunting list of problems.  However, there is also some good news, although in all cases it would be even better if positive trends were happening faster.

Good news from the last seven years

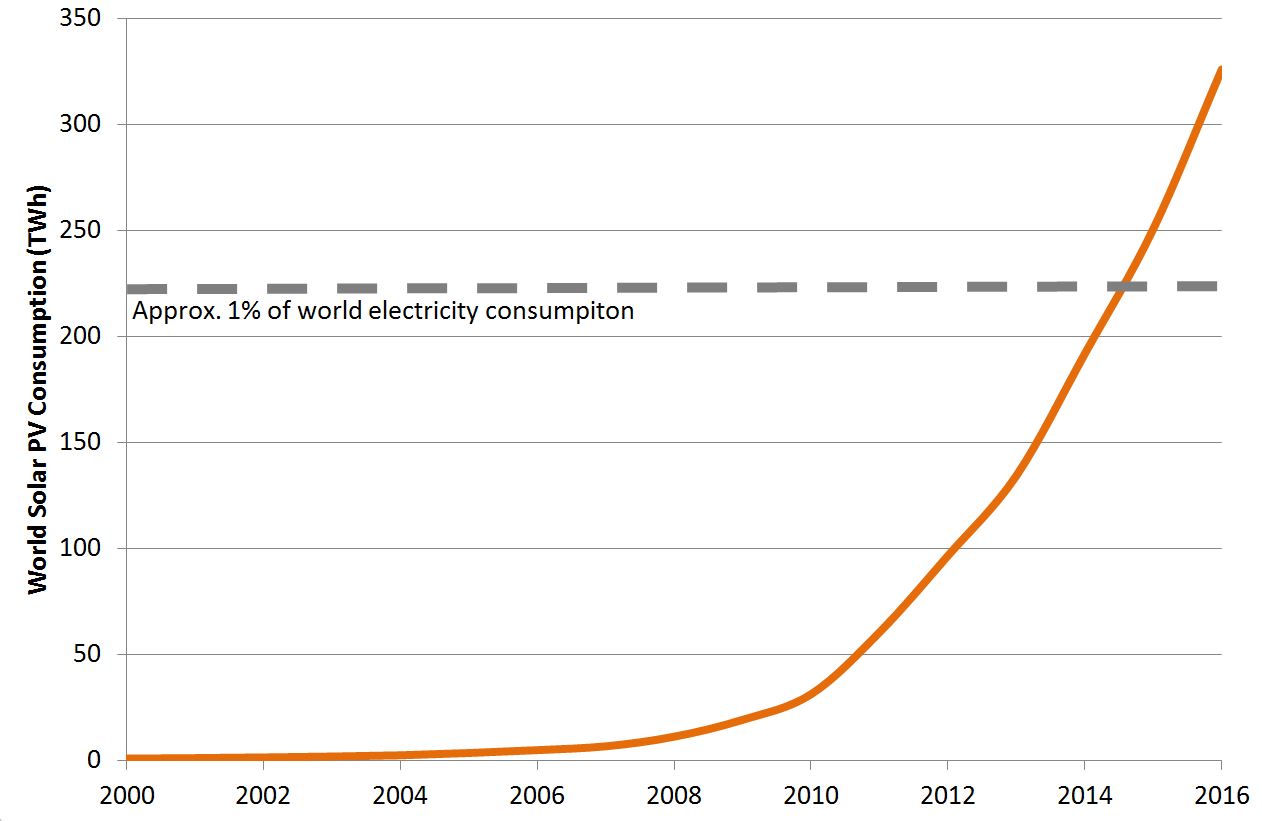
  1. Costs of low carbon technologies have fallen rapidly, and continue to fall.

Wind and solar electricity are in many cases now competitive with, and often cheaper than, electricity from new fossil fuel generation.  Falling battery costs will enable to the electrification of surface transport and help balance the grid.

This seems to me to be by far the greatest cause for optimism.  Low carbon options will simply become the default choice for new investment in many cases, and policies to reduce emissions will increasingly be working to support a trend that is driven by economic as well as environment imperatives.

  1. Some countries have put binding targets in place for net zero emissions.

The UK already has such a target for 2050, seeking to end the UK’s contribution to climate change.  The EU seems likely to formalise a similar target very soon.

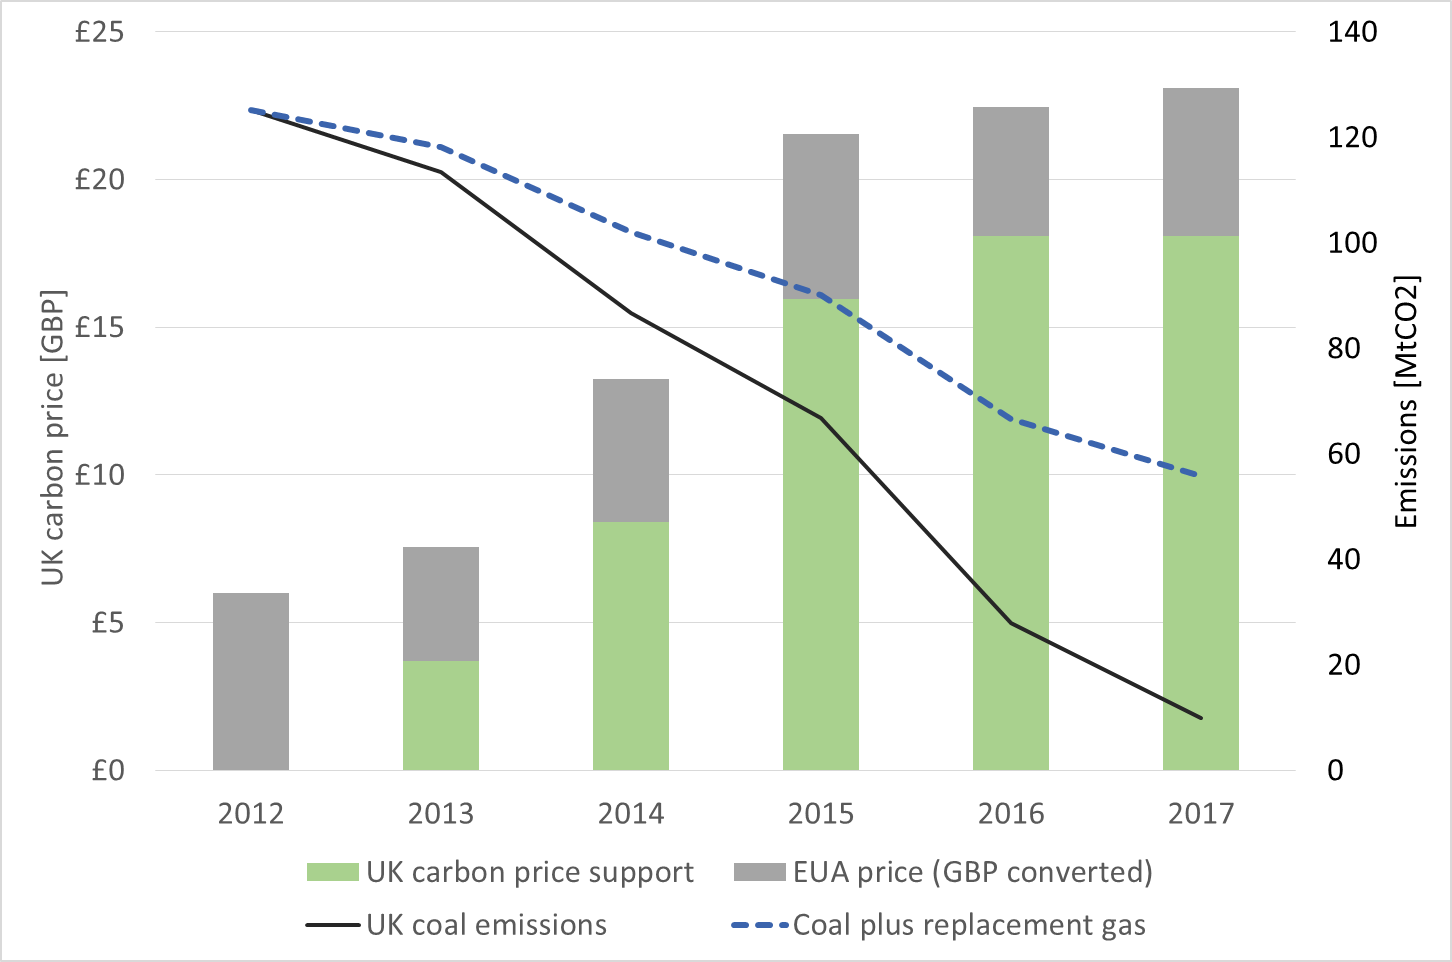
  1. Some countries have cut emissions significantly, showing what can be done.

The UK has cut its annual emissions by nearly 20% since 2013[iv], with the largest component of this being a reduction in coal use in the power sector, a change readily replicable elsewhere.

  1. Public concern about climate change has risen while scepticism about the science has largely disappeared, at least outside the USA and a few other countries.

85% of UK voters are now concerned about climate change[v] with over a quarter ranking it among their top three issues[vi].  This was reflected during the recent general election campaign[vii] in all parties offering policies to reduce emissions to net zero .  Over time this should create the political space for some of the more challenging policies that will be needed to reduce emissions to close to zero.

  1. Additional policies are being put in place, and carbon pricing is increasingly widespread.

For example, almost all major economies now have renewables targets, and there are over 50 carbon pricing systems in place around the world.

  1. Governments increasingly see economic opportunities in decarbonisation rather than costs.

The opportunities created by new industries are increasingly recognised as part of wider industrial policy.

  1. The Paris Agreement has been signed.

Almost all countries have now committed to limit temperature rises to below 2 degrees and to make a contribution to reaching that target, recognising different national circumstances.  Some may consider this is the main piece of good news over the past seven years.  However its effectiveness remains to be proven, and its success looks likely to depend on some of the other trends I’ve highlighted, notably falling costs for low carbon technologies.

Looking at these trends together, I am both less optimistic and more optimistic than I was in 2013.  I am less optimistic because seven years of rising emissions and continuing investment in high carbon infrastructure have made the challenge of limiting climate change even greater than it was.  But I am more optimistic because there is greater recognition and acceptance of the problem, more is now being done (though still nowhere near enough) and, above all, because low carbon energy is rapidly becoming cheaper than high carbon energy.  As a result it looks likely that emissions from the energy sector will eventually be greatly reduced and even halted entirely.  This may make it easier to focus on reducing other emissions as well, especially those from deforestation.

But eventually will be too late.  Much damage is already being done to our world.  More will inevitably follow. This will include the loss of irreplaceable parts of the natural world.  Given rising emissions, and how much of the carbon budget has been used up, it now looks practically impossible to keep temperature rises to 1.5 degrees, and difficult, though still possible, even to limit them to 2 degrees.

However it could still get much worse.  The task now is to avoid the worst of the risks by keeping emissions and accompanying temperature rises as low as possible, including keeping global temperature rises to below 2 degrees.  With a lot of effort and a little luck there is still time (just) to achieve this.  But the task has never been greater or more urgent.

Adam Whitmore – 9th March 2020

[i] For a 50% chance of remaining below 2 degrees, based on cumulative CO2 emissions.  See https://onclimatechangepolicydotorg.wordpress.com/2018/10/

[ii] https://www.globalccsinstitute.com/resources/global-status-report/

[iii] https://climateactiontracker.org/global/cat-emissions-gaps/

[iv] https://www.theccc.org.uk/publication/reducing-uk-emissions-2019-progress-report-to-parliament/

[v] https://www.ipsos.com/ipsos-mori/en-uk/concern-about-climate-change-reaches-record-levels-half-now-very-concerned

[vi] https://www.bbc.co.uk/news/science-environment-50307304

[vii] https://onclimatechangepolicydotorg.wordpress.com/2019/11/25/the-uks-political-consensus-on-climate-change/


How well is the UK on track for zero emissions by 2050?

By 2020 the UK will have very nearly halved its emissions over 30 years.  Reducing emissions by the same amount over the next 30 years will get the UK very close to zero.  However this will be very much more difficult.

A robust net zero target has been recommended for the UK …

A recent report by the UK’s Committee on Climate Change (CCC), the Government’s official advisory body, recommends that the UK adopts a legally binding target of net zero emissions of greenhouse gases by 2050[i], that is remaining emissions must be balanced by removal from the atmosphere.  If the Government agrees, this will be implemented by amending the reduction mandated by the Climate Change Act, from an 80% reduction from 1990 to a 100% reduction.

The target has several features that make it particularly ambitious.  It:

  • sets a target of net zero emissions covering all greenhouse gases;
  • includes international aviation and shipping;
  • allows no use of international offsets; and
  • is legally binding.

This is intended to end the UK’s contribution global warming.  It has no precedents elsewhere, although in France a bill with comparable provisions is under consideration[ii].

Progress to date has been good …

The UK has made good progress so far in reducing emissions since 1990.  Emissions in 2018 were around 45% below 1990 levels, having reduced at an average rate of about 12.5 million tonnes p.a. over the period.  On current trends, over the thirty years from 1990 to 2020 emissions will be reduced to about 420 million tonnes p.a., 47% below their 1990 levels.  Emissions will thus have nearly halved over the 30 years 1990 to 2020, half the period from 1990 to the target date of 2050.

Chart 1 shows how the UK’s progress compares with a linear track to the current target of an 80% reduction, to a 95% reduction and to a 100% reduction.  (For simplicity I’m ignoring international aviation and shipping).  The UK is currently on a linear track towards a 95% reduction by 2050.

Chart 1: Actual UK emissions compared with straight line progress towards different 2050 targets


Source: My analysis based on data from the Committee on Climate Change and UK Government.  Data for 2018 is provisional[iii]

The largest contributor to the total reduction so far has been the power sector.  Analysis by Carbon Brief[iv] showed that the fall in power sector emissions has been due to a combination deploying renewables, which made up about of third of generation in 2018, reducing coal use by switching to natural gas, and limiting electricity demand growth.

Industrial emissions have also fallen significantly.  However some of this likely represents heavy industry now being concentrated elsewhere in the world, so likely does not represent a fall in global emissions.  Emissions from waste have also fallen, due to better management.

Reducing emissions will be relatively easy in some sectors …

There are also reasons for optimism about continuing emissions reductions.  Many technologies are now there at scale and at competitive prices, which they were not in previous decades.  For example, falling renewables costs and better grid management, including cheaper storage, will help further decarbonisation of the power sector.  Electrification of surface transport now appears not only feasible, but likely to be strongly driven (at least for cars and vans) by economic factors alone as the cost of batteries continues to fall.

But huge challenges remain …

Nevertheless important difficulties remain for complete decarbonisation.

CCS is identified by the report as an essential technology.  However, as I have noted previously, it has made very little progress in recent years in the UK or elsewhere[v].  CCS is especially important for decarbonising industry.  This includes a major role for low carbon hydrogen, which is assumed to be produced from natural gas using CCS – although another possibility is that it comes from electrolysis using very cheap renewables power, e.g. at times of surplus.  CCS also looks to be necessary because of its use with bioenergy (BECCS), to give some negative emissions, though the lifecycle emissions from this will require careful attention

Decarbonising building heating, especially in the residential sector, continues to be a challenge.  The report envisages a mix of heat pumps and hydrogen, perhaps in the form of hybrid designs, with heat pumps providing the baseload being topped-up up by burning of hydrogen in winter.  I have previously written about the difficulties of widespread use of heat pumps[vi], and low carbon hydrogen from natural gas with CCS is also capital intensive to produce and therefore expensive to run for the winter only.  The scale of any programme and consumer acceptance remain major challenges, and the difficulties encountered by the UK’s smart meter installation programme – by comparison a very simple change – are not an encouraging precedent.

Emissions from agriculture are difficult to eliminate completely, and no technologies are likely to be available by 2050 that enable aviation emissions to be completely eliminated.  This will require some negative emissions to balance remaining emissions from these sectors.

Policy needs to be greatly strengthened …

Crucially several of the necessary transformations are very large scale, and need long lead times, and investment over decades.  There is an urgent need to make progress on these, and policy needs to recognise this.  This includes plans for significant absorption from reforestation, as trees need to be planted early enough that they can grow to be absorbing substantial amounts by 2050.

The UK’s progress on emissions reduction so far has been good, having made greater reductions than any other major economy[vii].  And technological advances in some areas are likely to enable substantial further progress.  However much more is needed.  In particular policy needs to look now at some of the difficult areas where substantial long-term investment will be needed

Adam Whitmore – 22nd May 2019


[i] https://www.theccc.org.uk/2019/05/02/phase-out-greenhouse-gas-emissions-by-2050-to-end-uk-contribution-to-global-warming/


[ii] The CCC report notes that Norway, Sweden and Denmark have net zero targets, but they allow use of international offsets (up to 15% in the case of Sweden).  France has published a target similar to the UK’s in a bill.  The European Commission has proposed something similar for the EU as a whole, but this is a long way from being adopted. California has non-legally binding targets to achieve net zero by 2045.  Two smaller jurisdictions (Costa Rica, Bhutan) have established net zero targets but these are expected to be achieved mainly by land use changes.  New Zealand has a draft bill to establish a target, but eliminating all GHGs will be difficult because of the role of agriculture in the New Zealand economy.


[iii] https://www.gov.uk/government/statistics/provisional-uk-greenhouse-gas-emissions-national-statistics-2018  The change from 2017 to 2018 is applied to the data series from 1990 produced by the CCC (the two data series differ very slightly in their absolute levels).


[iv] https://www.carbonbrief.org/analysis-uk-electricity-generation-2018-falls-to-lowest-since-1994


[v] https://onclimatechangepolicydotorg.wordpress.com/2018/04/25/a-limited-but-important-medium-term-future-for-ccs/


[vi] https://onclimatechangepolicydotorg.wordpress.com/2015/05/18/reducing-the-costs-of-decarbonising-winter-heating-needs-to-be-a-priority/


[vii] https://onclimatechangepolicydotorg.wordpress.com/2017/05/09/uk-emissions-reductions-offer-lessons-for-others/


Satellite data can help strengthen policy

Advancing satellite technology can improve monitoring of emissions.  This will in turn help make policies more robust.

There are now around 2000 satellites in earth orbit carrying out a wide range of tasks.  This is about twice as many as only a decade ago[i].   Costs continue to come down, technologies are advancing and more organisations are making use of data, applying new techniques as they do so.   As progress continues, satellite technologies are positioned to make a much larger contribution to monitoring greenhouse gas emissions.

Tracking what’s happening on the ground

Satellites are critical to tracking land use changes that contribute to climate change, notably deforestation.   While satellites have played an important role here for years, the increasing availability of data is enabling organisations to increase the effectiveness of their work.  For example, in recent years Global Forest Watch[ii] has greatly increased the range, timeliness and accessibility of its data on deforestation.  This in turn has enabled more rapid responses.

This is now extending to other monitoring.  For example, progress on construction projects can be tracked over time.  This enabled, for example, monitoring the construction of coal plant in China, which showed that construction of new plants was continuing[iii].

Monitoring operation and emissions

As the frequency with which satellite pictures are taken increases, it becomes possible to monitor not only construction and land use changes, but also operation of individual facilities.  For example, it is now becoming possible to track operation of coal plant, because the steam from cooling towers is visible[iv].  This can in turn allow emissions to be estimated.

More direct monitoring of emissions continues to develop.  Publicly available data at high geographic resolution on NOx, SOx, particulates and in the near future methane[v] are becoming increasingly available[vi].   For example, measuring shipping emissions has traditionally been extremely difficult, but is now becoming tractable, at least for NOx.

Measuring methane is especially important.  Methane is a powerful greenhouse gas with significant emissions from leakage in natural gas systems.  Many of these emissions can easily be avoided at relatively low cost, leading to highly cost-effective emissions reduction.

Monitoring CO2

CO2 is more difficult to measure than other pollutants, in part because it disperses and mixes in the atmosphere so rapidly.  However, some of the latest satellites have sophisticated technology able to measure CO2 concentrations very accurately[vii].  These cover only quite small areas at the moment but are expected to scale up and allow more widespread direct monitoring.  The picture below shows a narrow strip of the emissions from a coal plant in Kansas, based on data from the Orbiting Carbon Observatory 2 (OCO‐2) satellite.  These estimates conform well with reported emissions from the plant.

Figure 1:  Satellite data showing CO2 emissions for a power plant in Kansas

Note: the red arrow shows prevailing wind direction.

Space agencies around the world are now exploring how such monitoring can be taken further.  For example, the EU has now asked the European Space Agency to design a satellite dedicated to monitoring CO2.  It is expected to be operational in the 2020s.[viii]

Work is also underway to improve data analysis, so that quantities of emissions can be attributed to individual plants.  Machine learning holds a good deal of promise here as a way of finding and labelling patterns in the very large amounts of data available.  It is likely soon to be possible to monitor emissions from an individual source as small as a medium size coal plant, taking account of wind speed and direction and so forth.

Implications

These developments will make actions much more transparent and subject to inspection internationally.  Governments, scientists, energy companies, investors, academics and NGOs can monitor what is going on.  Increasingly polluters will not be able to hide their actions – they will be open for all to see.  This is turn will make it easier to bring pressure on polluters to clean up their act, potentially including, for example, holding countries to account for their Nationally Determined Contributions (NDCs) under the Paris Climate Agreement.

Improved transparency and robust data are not in themselves solutions for reducing climate change.  Instead, they play an important role in an effective policy architecture.  And the do so with ever increasing availability and quality.  This gives cause for optimism that policies and their implementation can be made increasingly robust.

Adam Whitmore – 12th September 2018

Thanks to Dave Jones for sharing his knowledge on the topic .

[i] https://www.ucsusa.org/nuclear-weapons/space-weapons/satellite-database#.W5Y-7ZNKhcA, https://allthingsnuclear.org/lgrego/new-update-of-ucs-satellite-database,

[ii] https://www.globalforestwatch.org/about

[iii] See here http://www.climatechangenews.com/2018/08/07/china-restarts-coal-plant-construction-two-year-freeze/ for examples

[iv] https://twitter.com/matthewcgray/status/1032251925515968512

[v] http://www.tropomi.eu/data-products/methane

[vi] https://www.scientificamerican.com/article/meet-the-satellites-that-can-pinpoint-methane-and-carbon-dioxide-leaks/

[vii] https://agupubs.onlinelibrary.wiley.com/doi/10.1002/2017GL074702

[viii] https://www.bbc.co.uk/news/science-environment-43926232


A limited but important medium term future for CCS

CCS has not yet been implemented on a scale needed to make a substantial difference to climate change.  However it continues to look necessary for the longer term, with more projects necessary to get costs down.

A decade or so ago many people expected rapid development of Carbon Capture and Storage (CCS) as a major contributor to reducing global emissions.  I was one of them – at the time I was working on developing CCS projects.  However, the hoped-for growth has not yet happened on the scale needed to make a material difference to global emissions.

The chart below shows total quantities captured from large CCS projects, including 17 that are already operational and a further 5 under construction.  The quantity of emissions avoided are somewhat lower than the captured volumes shown here due to the CO2 created by the process itself.[i]

Between 2005 and 2020 capture will have grown by only around 25 million tonnes p.a..  This is only 0.07% of annual global CO2 emissions from energy and industry.  In contrast the increase in wind generation in 2017 alone reduced emissions by around 60 million tonnes[ii], so wind power reduce annual emission more from about 5 months’ growth than CCS will from 15 years’ growth – though it took wind power several decades to get to this scale.    

Chart 1: Growth of large CCS projects over time

Source: Analysis based on Global Carbon Capture and Storage Institute database[iii]

The picture gets even less promising looking at the types of projects that have been built.  The chart below shows the proportion of projects, measured by capture volume, in various categories.  The largest component by some distance is natural gas processing – removing the CO2 from natural gas before combustion – which accounts for over 60% of volumes.  This makes sense, as it is often a relatively low cost form of capture, and is often necessary to make  natural gas suitable for use.  However, it will clearly not be a major component of a low carbon energy system.  Much of the rest is chemicals production, including ethanol and fertiliser production.  These are helpful but inevitably small. There are just two moderate size power generation projects and two projects for hydrogen production, which is often considered important for decarbonising heat.

Furthermore, most of the projects separate out CO2 at relatively high concentrations or pressures.  This tends to be easier and cheaper than separating more dilute, lower pressure streams of CO2.  However it will not be typical of most applications if CCS is to become more widespread.

Chart 2:  Large CCS projects by type (including those under construction) 

Source: Analysis based on Global Carbon Capture and Storage Institute database

This slow growth of CCS has been accompanied by at least one spectacular failure, the Kemper County power generation project, which was abandoned after expenditure of several billion dollars.  Neither the circumstances of the development or the technology used on that particular plant were typical.  For example, the Saskpower’s project at Boundary Dam and Petra Nova’s Texas project have both successfully installed post combustion capture at power plants, rather than the gasification technologies used at Kemper County.  Nevertheless, the Kemper project’s failure is likely to act as a further deterrent to wider deployment of CCS in power generation.

There have been several reasons for the slow deployment of CCS.  Costs per tonne abated have remained high for most projects compared with prevailing carbon prices.  These high unit costs have combined with the large scale of projects to make the total costs of projects correspondingly large, with a single project typically having a cost in the billions of dollars.  This has in turn made it difficult to secure from governments the amount of financial support necessary to get more early projects to happen. Meanwhile the costs of other low carbon technologies, notably renewables, have fallen, making CCS appear relatively less attractive, especially in the power sector.

The difficulties of establishing CCS have led many to propose carbon capture and utilisation (CCU) as a way forward.  The idea is that if captured CO2 can be a useful product, this will give it a value and so improve project economics.  Already 80% by volume of CCS is CCU as it includes use of the CO2 for Enhanced Oil Recovery (EOR), with project economics supported by increased oil production.

Various other uses for CO2 have been suggested.  Construction materials are a leading candidate with a number of research projects and start-up ventures in this area.  These are potentially substantial markets.  However the markets for CO2 in construction materials, while large in absolute terms, are small relative to global CO2 emissions, and there will be tough competition from other low carbon materials. For example, one study identified a market potential for CCU of less than two billion tonnes p.a. (excluding synthetic fuels) even on a highly optimistic scenario[iv], or around 5% of total CO2 emissions.  It is therefore difficult to be confident that CCU can make a substantial contribution to reducing global emissions, although it may play some role in getting more early carbon capture projects going, as it has done to date through EOR.

Despite their slow growth, CCS and CCU continue to look likely to have a necessary role in reducing some industrial emissions which are otherwise difficult to eliminate.  The development of CCS and CCU should be encouraged, including through higher carbon prices and dedicated support for early stage technological development.  As part of this it remains important that more projects CCS and CCU projects are built to achieve learning and cost reduction, and so support the beginnings of more rapid growth.  However in view of the lead times involved the scale of CCS looks likely to continue to be modest over the next couple of decades at least.

Adam Whitmore – 25th April 2018

[i] CO2 will generally be produced in making the energy necessary to run the capture process, compression of the CO2 for transport, and the rest of the transport and storage process.  This CO2 will be either emitted, which reduces the net gain from capture, or captured, in which case it is part of the total.  In either case the net savings compared with what would have been emitted to the atmosphere with no CCS are lower than the total captured.

[ii] Wind generation increased by a little over 100 TWh between 2016 and 2017 (Source: Enerdata).  Assuming this displaced fossil capacity with an average emissions intensity of 0.6 t/MWh (roughly half each coal and gas) total avoided emissions would be 60 million tonnes.

[iii] https://www.globalccsinstitute.com/projects/large-scale-ccs-projects

[iv] https://www.frontiersin.org/articles/10.3389/fenrg.2015.00008/full

Economic growth and emissions cuts can go together

There is often said to be a trade-off between growth and decarbonisation, but the evidence shows that advanced economies can combine large emissions cuts with continuing economic growth.

Policy on greenhouse gas emissions reductions is often framed as a trade-off between greater emissions reductions and greater economic growth.  However, while emissions clearly can’t be reduced to zero immediately, faster emissions reductions can be accompanied by robust economic performance.  The clearest example of this is the UK.  Since 1990 the UK has cut its total greenhouse gas emissions much more rapidly than other G7 countries, while growing its economic output per capita more than the average.  This is illustrated in Chart 1.

Chart 1: UK per capita GDP growth and greenhouse gas emissions compared with the G7 average[i]

The extent by which the UK has cut its per capita emissions relative to other countries is emphasised in the following charts, which show that the UK has achieved by far the largest reductions in per capita CO2 emissions.

Chart 2: CO2 emissions per capita in 2016 and 1990 for G7 countries[ii]

Note: Japanese emissions rose by 0.4 tonnes per capita over the period (not shown)

Chart 3: Change in per capita and total CO2 emissions 1990 to 2016 for G7 countries

Note: Data in these charts is for CO2 only, excluding other greenhouse gases.

Of course, some of the relative changes reflect circumstances.  The UK started with relatively high emissions, including extensive use of coal in power generation.  In contrast, France already had a low carbon power sector in 1990, and in 2016 France’s per capita emissions remained about 8% below those of the UK, even though UK emissions had fallen much more from their 1990 levels.

Germany has also achieved significant reductions, having benefitted from reductions in emissions in the former East Germany and installing large amounts of renewables.  However it has been hampered by continuing extensive use of coal and lignite for power generation.  The USA has accommodated significant population growth with only a small rise in emissions, but this is clearly nowhere near enough if it is to make an appropriate contribution to global reductions.  Emissions remain at almost three times UK levels.  Canadian emissions are also high and have increased in absolute terms.  Japan’s emissions have grown slightly over the period.

Some falls in emissions in G7 economies may reflect a shift in the global pattern of emissions, with reduced emissions from industry in the G7 economies balanced by increases in China and elsewhere.  However this can’t account for all of the reductions that have been achieved, or the vast differences in reductions between countries.

Policy has certainly also played its part.  UK policy has successfully targeted relatively low cost emissions reduction, notably reducing coal use in the power sector.  Above all the Climate Change Act (2008) has provided a consistent and rigorous policy framework.

And whatever the reason, one thing is clear.  Cutting emissions more can accompany growing the economy more.

Adam Whitmore – 8th March 2018


[i]https://www.gov.uk/government/uploads/system/uploads/attachment_data/file/651916/BEIS_The_Clean_Growth_online_12.10.17.pdf

[ii] http://www.pbl.nl/en/publications/trends-in-global-co2-and-total-greenhouse-gas-emissions-2017-report

Emissions reductions from carbon pricing can be big, quick and cheap

The UK carbon tax on fuel for power generation provides the most clear-cut example anywhere in the world of large scale emissions reductions from carbon pricing.   These reductions have been achieved by a price that, while higher than in the EU ETS, remains moderate or low against a range of other markers, including other carbon taxes.

The carbon price for fuels used in power generation in the UK consists of two components.  The first is the price of allowances (EUAs) under the EUETS.  The second is the UK’s own carbon tax for the power sector, known as Carbon Price Support (CPS).  The Chart below shows how the level CPS (green bars on the chart) increased over the period 2013 to 2017[i].  These increases led to a total price – CPS plus the price of EUAs under the EUETS (grey bars on the chart) – increasing, despite the price of EUAs remaining weak.

This increase in the carbon price has been accompanied by about a 90% reduction in emissions from coal generation, which fell by over 100 million tonnes over the period (black line on chart).   Various factors contributed to this reduction in the use of coal in power generation, including the planned closure of some plant and the effect of regulation of other pollutants.  Nevertheless the increase in the carbon price since 2014 has played a crucial role in stimulating this reduction in emissions by making coal generation more expensive than gas[ii].  According to a report by analysts Aurora, the increase in carbon price support accounted for three quarters of the total reduction in generation from coal achieved by 2016[iii].

The net fall in emissions over the period (shown as the dashed blue line on chart) was smaller, at around 70 million tonnes p.a. [iv] This is because generation from coal was largely displaced by generation from gas. The attribution of three quarters of this 70 million tonnes to carbon price support implies a little over 50 million tonnes p.a. of net emission reductions due to carbon price support.   This is equivalent to a reduction of more than 10% of total UK greenhouse gas emissions.  The financial value of the reduced environmental damage from avoiding these emissions was approximately £1.6 billion in 2016 and £1.8 billion in 2017[v].

Chart:  Carbon Prices and Emissions in the UK power sector

The UK tax has thus proved highly effective in reducing emissions, producing a substantial environmental benefit[vi].  As such it has provided a useful illustration both of the value of a floor price and more broadly of the effectiveness of carbon pricing.

This has been achieved by a price that, while set at a more adequate level than in the EU ETS, remains moderate or low against a range of other markers, including other carbon taxes.  CPS plus the EUA price was around €26/tCO2 in 2017 (US$30/tCO2).  The French the carbon tax rose from €22/tCO2 to €31/tCO2 over 2016-2017. In Canada for provinces electing to adopt a fixed price the carbon price needs to reach CAN$50/tCO2 (€34/tCO2) by 2022[vii].  These levels remain below US EPA 2015 estimates of the Social Cost of Carbon of around €40/tCO2 [viii].

This type of low cost emissions reduction is exactly the sort of behaviour that a carbon price should be stimulating, but which is failing to happen as a result of the EU ETS because the EUA price is too low.  More such successes are needed if temperature rises are to be limited to those set out in the Paris Agreement.  This means more carbon pricing should follow the UK’s example of establishing an adequate floor price.  This should include an EU wide auction reserve for the EUETS.  The reserve price should be set at somewhere between €30 and €40/t, increasing over time.  This would likely lead to substantial further emissions reductions across the EU.

Adam Whitmore – 17th January 2018

Notes:

[i] Emissions date for 2017 remains preliminary.  UK carbon price support reached at £18/tCO2 (€20/tCO2) in the fiscal year 2015/6 and was retained at this level in 2016/7.  In 2013/4 and 2014/5 levels were £4.94 and £9.55 respectively.  This reflected defined escalation rates and lags in incorporating changes in EUA prices. https://www.gov.uk/government/uploads/system/uploads/attachment_data/file/293849/TIIN_6002_7047_carbon_price_floor_and_other_technical_amendments.pdf and www.parliament.uk/briefing-papers/sn05927.pdf

[ii] http://www.theenergycollective.com/onclimatechangepolicy/2392892/when-carbon-pricing-works-2

[iii] https://www.edie.net/news/6/Higher-carbon-price-needed-to-phase-out-UK-coal-generation-by-2025/

[iv] Based on UK coal generation estimated weighted average emissions intensity of 880gCO2/kWh, and 350gCO2/kWh for gas generation.

[v] 50 million tonnes p.a. at a social cost of carbon based on US EPA estimates of $47/tonne (€40/tonne).

[vi] There is a standard objection to a floor in one country under the EUETS is that it does not change of the overall cap at an EU level so, it is said, does not decrease emissions.  However this does not hold under the present conditions of the EUETS, and is unlikely to do so in any case.  A review of how emissions reductions from national measures, such as the UK carbon price floor, do in fact reduce total cumulative emissions over time is provided was provided in my recent post here.

[vii] The tax has now set at a fixed level of £18/tonne.  It was previously set around two years in advance, targeting a total price comprising the tax plus the EUA price.  There was no guarantee that it would set a true floor price, as EUA prices could and did change a good deal in the interim.  Indeed, in 2013 support was set at £4.94/tCO2, reflecting previous expectations of higher EUA prices, leading to prices well below the original target for the year of £16/tCO2 in 2009 prices (around £17.70 in 2013 prices). See https://openknowledge.worldbank.org/handle/10986/28510?locale-attribute=en.  The price is also below the levels expected to be needed to meet international goals (see section 1.2), and below the social cost of carbon as estimated by the US EPA (see https://onclimatechangepolicydotorg.wordpress.com/carbon-pricing/8-the-social-cost-of-carbon/ and references therein).

[viii] Based on 2015 estimates.

The case for additional actions in sectors covered by the EUETS is now even stronger

Recently agreed reforms to the EUETS mean that excess allowances in the MSR will be cancelled.  This further strengthens the case for actions such as phase-out of coal plant, increasing energy efficiency and deploying more renewables.

About a year ago I looked at whether additional actions to reduce emissions in sectors covered by the EUETS do in practice lead to net emissions reductions over time [i].

It is sometimes claimed that total emissions are always equal to the fixed cap.  By implication additional actions do not reduce total emissions, because if emissions are reduced in one place there will be a corresponding increase elsewhere.  This is sometimes called the “waterbed hypothesis” by analogy – if you squeeze in one place there is an equal size bulge elsewhere.

Although often repeated, this claim is untrue.  Under the EU ETS at present the vast majority of emissions reductions from additional actions will be permanently retained, reflecting the continuing surplus of allowances and the operation of the MSR.  Furthermore, over the long term the cap is not fixed, but can respond to circumstances.  For example, tighter caps can be set by policy makers once emissions reductions have been demonstrated as feasible.

When I last looked at this issue, the fate of additional allowances in the MSR remained necessarily speculative.  It was clear that additional excess allowances would at least not return to the market for decades.  It also seemed likely that they would be cancelled.  However, no cancellation mechanism was then defined.

This has now changed with the trilogue conclusions reached last week, which include a limit on the size of the MSR from 2023.  The limit is equal to the previous year’s auction volume, and is likely, given the size of the current surplus, to lead to large numbers of allowances being cancelled in the 2020s.

With this limit in place there is a very clear pathway by which allowances freed up by additional actions, such as reduced coal burn or increased renewables, will add to the surplus, be transferred to the MSR then cancelled (see diagram).  Total emissions under the EUETS will be correspondingly lower.

There is now a clear mechanism by which additional actions reduce total emissions

Modelling confirms that with the limit on the size of the MSR in place a large majority of reductions from non-ETS actions are retained, because additional allowances freed up almost all go into the MSR, and are then cancelled.  This is shown in the chart below for an illustrative case of additional actions which reduce emissions by 100 million tonnes in 2020.  Not all of the allowances freed up by additional actions are cancelled.  First there is a small rebound in emissions due to price changes (see references for more on this effect).  Then, even over a decade, the MSR does not remove them all from circulation.  This is because it takes a percentage of the remainder each year, so the remainder successively decreases, but does not reach zero.  If the period were extended beyond 2030 a larger proportion would be cancelled, assuming a continuing surplus.  Nevertheless over 80% of allowances freed up by additional actions are cancelled by 2030.

The benefit of additional actions is thus strongly confirmed.

The large majority of allowances freed up by additional actions are eventually cancelled

Source: Sandbag

When the market eventually returns to scarcity the effect of additional actions becomes more complex.  However additional actions are still likely to reduce future emissions, for example by enabling lower caps in future.

Policy makers should pursue ambitious programmes of additional action in sectors covered by the EUETS, confident of their effectiveness in the light of these conclusions.  Some of the largest and lowest cost gains are likely to be from the phase out of coal and lignite for electricity generation, which still accounts for almost 40% of emissions under the EUETS.  Continuing efforts to deploy renewables and increase energy efficiency are also likely to be highly beneficial.

Adam Whitmore – 15th November 2017

[i] See https://onclimatechangepolicydotorg.wordpress.com/2016/10/21/additional-actions-in-euets-sectors-can-reduce-cumulative-emissions/  For further detail see https://sandbag.org.uk/project/puncturing-the-waterbed-myth/ .  A study by the Danish Council on Climate Change reached similar conclusions, extending the analysis to the particular case of renewables policy.  See Subsidies to renewable energy and the european emissions trading system: is there really a waterbed effect? By Frederik Silbye, Danish Council on Climate Change Peter Birch Sørensen, Department of Economics, University of Copenhagen and Danish Council on Climate Change, March 2017.

Prospects for Electric Vehicles look increasingly good

Electric vehicles update

Indicators emerging over the last 18 months increase the likelihood of plug-in vehicles becoming predominant over the next 20 years.  However, continuing strong policy support is necessary to achieve this.

Several indicators have recently emerged for longer term sales of plug-in vehicles (electric vehicles and plug-in hybrids).  These include targets set by governments and projections by analysts and manufacturers.

The chart shows these indicators compared with three scenarios for the growth of plug-in vehicles globally if policy drivers are strong.  (The scenarios are based on those I published around 18 months ago, and have been slightly updated for this post – see the end of this post and previous post for details.) The green lines show the share of sales, and the blue lines show the share of the total vehicle stock.  Other indicators are marked on the chart as diamonds, shown in green as they correspond to the green lines.  I’ve excluded some projections from oil companies as they appear unrealistic.

The scenarios show plug in vehicles sales in 2040 at between just over half and nearly all of new light vehicles.  However the time taken for the vehicle fleet to turn over means that they are a smaller proportion of the fleet, accounting for between a third and about three quarters of the light vehicle fleet by 2040.  The large range of the scenarios reflects the large uncertainties involved, but they all show plug-in vehicles becoming predominant over the next 20 years or so.

The indicators shown are all roughly in line with the scenario range (see detailed notes at the end of this post), giving additional confidence that the scenario range is broadly realistic, although the challenges of achieving growth towards the upper end of the range remain formidable.  Some of the projections by manufacturers and individual jurisdictions are towards the top end of the range, but the global average may be lower.

Chart.  Growth of sales of Plug-in light vehicles


The transition will of course need to be accompanied by continuing decarbonisation of the power sector to meet greenhouse gas emissions reduction goals.

Maintaining the growth of electric vehicle sales nevertheless looks likely to require continuing regulatory drivers, at least for the next 15 years or so.  This will include continuing tightening emissions standards on CO2 and NOx and enabling charging infrastructure.  If these things are done then the decarbonisation of a major source of emissions thus now seems well within sight.

Adam Whitmore – 13th October 2017


Background and notes

This background section gives further information on the data shown on the chart.  In some cases it is unclear from the reports whether projections are for pure electric vehicles only or also include plug-in hybrids.

Developments in regulation

Policy in many countries seems increasingly to favour plug-in vehicles.  Some recent developments are summarised in the table below.   These policy positions for the most part still need to be backed by solid implementation programmes.  Nevertheless they appear to increase the probability that growth will lie within the envelope of the projections shown above, which are intended to correspond to a world of strong policy drivers towards electrification.

Policy developments 

Jurisdiction Policy commitment
UK Prohibit sale of new cars with internal combustion engines by 2040[1]
France Prohibit sale of new cars with internal combustion engines by 2040[2]
Norway All new sales electric by 2025[3]
India All cars electric by 2030 (which appears unrealistic so goal may be modified, for example to new cars)[4]
China Reportedly considering a prohibition on new petrol and diesel.  Date remains to be confirmed, but target is for 20% of the market to be electric by 2025.[5]


Sales

The market is currently growing rapidly from a low base.  Total vehicle sales were 0.73 million in 2016, compared with 0.58 million in 2015.  Six countries have reached over 1% electric car market share in 2016: Norway, the Netherlands, Sweden, France, the United Kingdom and China. Norway saw 42% of sales being EVs in June 2017

Manufacturers’ projections

Several manufacturers have issued projections for the share of their sales they expect to be for plug-in vehicles.  Some of these are shown in the table.

Manufacturers’ projections for sales of plug-in vehicles


Manufacturer Target/expectation for plug-in vehicles
Volkswagen 20-25% of sales by 2025[6]
Volvo All new models launched from 2019[7]
PSA ( Peugeot and Citroen brands) 80% percent of models electrified by 2023[8]


Clearly individual manufacturers’ projections may not be achieved, and to some extent the statements may be designed to reassure shareholders that they are not missing an opportunity.  So far European manufacturers have been slow to develop EVs.  Also these manufacturers may not representative of the market as a whole.  Other companies may progress more slowly.

However others may proceed more quickly.  As has been widely reported, Tesla has taken over 500,000 advanced orders for its Model 3 EV, itself equivalent to almost the entire market for electric vehicles in 2015.  And in line with the Chinese Government’s targets manufacturers in China are expected to increase production rapidly.

Projections by other observers

Projections by other observers are in most cases now in line with the scenairos shown here.

  • Morgan Stanley project 7% of global sales by 2025[9]
  • BNP Paribas project 11% of global sales by 2025, 26% by 2030[10]
  • JP Morgan profject 35% of sales by 2025 and 48% of sales by 2030[11]
  • Last year Bloomberg’s projections showed growth to be slower than with these projections. However they have since updated their analysis, showing 54% of new cars being electric by 2040[12].
  • DNV.GL recently published analysis showing EV’s accounting for half of sales globally by 2033, in line with the mid case in this analysis.

In contrast BP predicts much slower growth in their projections[13].  However BP’s view seems implausibly low in any scenario in which regulatory drivers towards EVs are as strong as they appear to be.  Exxon Mobil gives lower projections still, while OPEC’s are a little above BP’s but still well below the low case shown here.[14].

Notes on changes to projections since May 2016

These projections are updated from my post last year but the differences over the next 15 years are comparatively minor.  The projections are for light vehicles, so exclude trucks and buses.  Note that percentage growth in early years has been faster than shown by the s-curve model – however this is likely to prove a result of the choice of a simple function.  What matters most for emissions reductions is the growth from now and in particular through the 2020s.

Assumption change Rationale
Higher saturation point Continuing advances in batteries reduce the size of the remaining niche for internal combustion engine vehicles
Longer time to saturation The higher saturation point will need additional time to reach.
Somewhat slower growth in total numbers of vehicles Concerns about congestion and changed modes of ownership and use are assumed to lead to lower growth in the total vehicle stock over time.  This tends to make a certain percentage penetrations easier to achieve because the percentage applies to fewer vehicles.


[1] http://www.bbc.co.uk/news/uk-40723581

[2] http://www.bbc.co.uk/news/world-europe-40518293

[3] http://fortune.com/2016/06/04/norway-banning-gas-cars-2025/

[4] https://electrek.co/2016/03/28/india-electric-cars-2030/

[5] http://www.bbc.co.uk/news/business-41218243

[6] http://www.bbc.co.uk/news/business-36548893

[7] https://www.media.volvocars.com/global/en-gb/media/pressreleases/210058/volvo-cars-to-go-all-electric

[8] http://www.nasdaq.com/video/psa-prepared-for-electric-vehicle-disruption–says-ceo-59b80a969e451049f87653d9

[9] https://www.economist.com/news/business/21717070-carmakers-face-short-term-pain-and-long-term-gain-electric-cars-are-set-arrive-far-more

[10] https://www.economist.com/news/business/21717070-carmakers-face-short-term-pain-and-long-term-gain-electric-cars-are-set-arrive-far-more

[11] https://www.cnbc.com/2017/08/22/jpmorgan-thinks-the-electric-vehicle-revolution-will-create-a-lot-of-losers.html

[12] https://about.bnef.com/electric-vehicle-outlook/

[13] https://www.bp.com/en/global/corporate/energy-economics/energy-outlook.html

[14] https://www.economist.com/news/briefing/21726069-no-need-subsidies-higher-volumes-and-better-chemistry-are-causing-costs-plummet-after

Underestimating the contribution of solar PV risks damaging policy making

A brief update on this post can be found here https://onclimatechangepolicydotorg.wordpress.com/2019/01/21/the-ieas-solar-pv-projections-are-more-misleading-than-ever/

Underestimating the contribution of solar PV risks damaging policy making

The continuing lack of realism in projections for solar PV risks damaging policy making by misdirecting effort in developing low carbon technologies.

Solar PV continues its remarkable growth …

Electricity generation from solar PV continues to grow very rapidly.  It now supplies over 1% of global electricity consumption and this proportion looks set to continue growing very rapidly over the next decade as costs continue to fall.

Chart 1 Rapid growth of solar PV generation continues

Sources: BP statistical review of world energy [i].  1% of consumption based on data for generation with an adjustment for losses.

Many studies have underestimated this growth and continue to do so …

This growth has been much faster than many predicted.  In 2013 and again in 2015  I noted[ii] that the IEA’s annual World Energy Outlook (WEO) projections for both wind and solar PV were consistently vastly too low.  Specifically, the IEA’s projections showed the annual rate of installation of wind and solar PV capacity remaining roughly constant, whereas in fact it both were increasing rapidly.  Updated analysis for solar PV recently published by Auke Hoekstra[iii] shows that this position seems remarkably unchanged (see Chart 2).  The repeated gross divergence between forecasts and outturns over so many years makes it hard to conclude anything other than the IEA is showing a wilful disconnection with reality in this respect, though their historical data on the energy sector remains very valuable.

Chart 2:  IEA projections for solar PV capacity continue to vastly underestimate growth

Although the IEA’s projections are particularly notable for their inability to learn from repeated mistakes, others have also greatly underestimated the growth of solar PV[iv].    Crucially, as a recent study in Nature Energy[v] shows, this tendency extends to many energy models used in policy making, including those relied on by the IPCC in its Assessment Reports.

This is largely because models have underestimated both the effect of policy support on deployment and the rate of technological progress, and so have underestimated the resulting falls in cost both in absolute terms and relative to other technologies.  Where new information has been available there has often been a lag in incorporating it in models.  Feedbacks between cost falls, deployment and policy may also have been under-represented in many models.  Consequently models have understated both growth rates and ultimate practical potential for solar PV.

This damages policy making  …

Does this matter?  I think it does, for at least two reasons.

First, if policy is based on misleading projections about the role of different technologies then policy support and effort will likely be misdirected.  For example, means of integrating solar PV at very large scale into energy systems look to have been under-researched and under-supported.  Other low carbon technologies such as power generation with CCS may have received more attention in comparison to their potential[vi].

Second, there is a risk of damaging the policy debate.  In particular there is a risk of exacerbating polarisation of the debate, rather than creating a healthy mix of competing judgements.  There is already a tendency for some commentaries on energy to favour fossil energy sources, and perhaps nuclear, and for others to favour renewables – what one might call “traditionalist” and “transitionalist” positions.  Traditionalists, including many energy companies, tend to point to the size and inertia of the energy system and the problems of replacing the current system with new sources of energy.  Transitionalists, including many entrepreneurs and environmentalists, tend to emphasise the urgent need to reduce emissions, the speed of change in technologies and costs now underway, and the exciting business opportunities created by change.

Both perspectives have merit, and the debate is too important to ignore either.  The IEA provides an example of distorting the debate. It will naturally, due to its history, tend to be seen as to some extent favouring the traditionalist viewpoint.  If this perception is reinforced by grossly unrealistic projections for renewables it risks devaluing the IEA’s other work even when it is more realistic, leaving it on one side of the debate. An opportunity for a balanced contribution from a major institution is lost.  The debate will be more polarised as a result, risking misleading policy makers, and distorting policy choices.

Securing balanced, well informed debate on the transition to a low carbon energy system is quite challenging enough.  Persistently underestimating the role of a major technology does not help.

Adam Whitmore -26th September 2017


[i] http://www.bp.com/content/dam/bp/en/corporate/pdf/energy-economics/statistical-review-2017/bp-statistical-review-of-world-energy-2017-renewable-energy.pdf

[ii] For details see here, here and  here

[iii]  https://steinbuch.wordpress.com/2017/06/12/photovoltaic-growth-reality-versus-projections-of-the-international-energy-agency/

[iv] An exception, as I have previously noted is work by Greenpeace.  Some previous scenario work by Shell was also close on wind and solar, but greatly overestimated the role of CCS and biofuels.

[v] The Underestimated Potential for Solar PV Energy to Mitigate Climate Change, Creutzig et. a. Nature Energy, Published 28/08/17

[vi] CCS still looks essential for decarbonisation in some cases, and given lead times for its development continued research and early deployment is still very much needed.  This is especially so for industrial applications.  Deployment in power generation looks likely to be more limited over the next decade or more, though some may still be needed when to move to very low emissions, and eventually to zero net emissions.  However the contribution of CCS to power generation now looks likely to be much less than that from solar PV.

A chance to change some dubious climate accounting

The UK should change the way it accounts for emissions under its legally binding carbon budgets, whether or not it remains part of the EUETS.

An apparently technical question about the UK’s accounting for its carbon budgets raises broader questions about alignment of targets and policy instruments.

The UK’s carbon budgets are legally binding obligations under the Climate Change Act (2008) to limit total emissions from the UK.  Checking whether emissions are within the budget ought to be simple.  Measure the UK’s emissions to see if they are at or under budget.  If not there’s a problem.

But it does not work that way.  For sectors not covered by the EUETS actual emissions are indeed used.  However for those sectors covered by the EUETS – power generation and large industry – emissions are deemed always to be equal to the UK’s allocation under the EUETS (which is made up of both auctioned allowances allocated free of charge[1]), whatever emissions are in reality.  Actual emissions from the covered sectors could be much higher and carbon budgets would still be met

While this may sound bizarre, there was a logic to it when the rules were established.  If UK emissions from the traded sector are above the UK’s allocation UK emitters need to buy in EUAs.  If the scheme were short of allowances, as was expected when present accounting rules were set, the additional EUAs bought by UK emitters to cover emissions above the UK’s allocation would lead to reduced supply of EUAs for others.  There would in consequently be reduced emissions elsewhere matching the increased emissions in the UK.  The approach was therefore to some extent a reliable measure of net emissions.  It also aligned with the EUETS having clear National Allocation Plans (NAPs) for EUAs for each Member State, something that no longer exists.

Now this type of accounting no longer makes sense.  With a large surplus of allowances in the EUETS, if the covered sectors in the UK emit more than their budget they will simply buy surplus allowances.  These allowances would otherwise almost all eventually be placed in the Market Stability Reserve (MSR).  Under current proposals (and indeed most likely eventualities), these EUAs would eventually be cancelled.  Additional emissions in the UK are therefore not balanced by reductions elsewhere – they simply result in buying surplus EUAs which would never be used.  This type of situation is sometimes called “buying hot air”.

To avoid this occurring in future, accounting for carbon budgets needs to change to actual emissions.  This will necessarily happen anyway if the UK leaves the EU ETS.  UK allocations under the EUETS will no longer exist. Accounting cannot be based on a non-existent allocation.

But even if the UK stays part of the EU ETS the basis of accounting should change to prevent the UK is meeting its carbon budgets by simply buying in surplus EUAs.

The possibility of buying in surplus to cover UK emissions appears quite real.  UK emissions were above allocation until quite recently.  This was not too serious a problem then, because carbon budgets were being met fairly comfortably anyway.  However the situation may recur under the 2020s and early 2030s under fourth and fifth carbon budgets, which will be much more challenging to meet.  Total UK emissions could be allowed to rise above those carbon budgets simply as a result of an accounting treatment[2].

When a target applies to a jurisdiction that does not wholly align with the policy instrument there will always be a need to consider circumstances in assessing whether targets are being met.  The UK should not be able to meet its carbon budgets simply due to an accounting convention.  Current rules were put in place before the current oversupply under the EUETS arose.  It is no longer fit for purpose.  It should be changed to accounting based on actual emissions whether or not the UK is part of the EUETS.

Adam Whitmore -20th June 2017

[1] This consists of auctioning plus free allowances plus UK allocation under the NER. In Phase 4 it would also include any allocation from the Innovation Fund. Future volumes placed in the MSR and thus excluded from auctioning would also be deducted from the total. If the UK were to leave the EU ETS and backloaded UK allowances currently destined for the MSR were to return to the market this would have a significant effect on measured performance against carbon budgets under current accounting.

[2] Whether this led to total actual emissions being above carbon budgets would depend on the performance of the non-traded sector.