Author Archives: adamwhitmore

Plausible mixes of energy sources in a low carbon system

Solar and wind will together need to provide well over half of energy in a decarbonised system.  Based on present trends they seem likely to be able to do so, although there will inevitably be challenges.

There are only a few types of energy source which can plausibly make a substantial contribution to a near zero carbon energy system.  There are renewables, mainly hydro, wind, solar and bioenergy.  Other renewables, including geothermal, tidal and wave energy are likely to continue to be relatively small globally.  There is also nuclear, and fossil fuels with CCS. 

Currently, these low carbon sources in total account for only around 15% of final energy consumption globally, excluding traditional biomass. This needs to grow to close to 100% over the next few decades. 

The predominant role of solar and wind

So, which of the potential sources will provide the bulk of the energy?  Here, I assessed plausible maximum contributions over the next few decades are assessed for each energy source, other than solar and wind.  The assessment takes account of the following for each energy source. 

  • Current scale and past growth
  • Physical resource constraints, for example for hydro.
  • Project development supply chain lead times, for example storage development for CCS
  • Scalability
  • Costs

With each of the other technologies at their plausible maximum, solar and wind are assumed to fill the remaining gap in energy supply.   

The results of this analysis are shown in Chart 1[i] (see below for brief notes on each energy source).  Also shown is recent analysis by the IEA[ii] of potential energy mixes. Although the IEA does not explicitly address the issue of plausible maximums, the estimates are broadly similar in most cases.  The exception of bioenergy, where the IEA shows much more than found in the analysis here.  Bioenergy will likely be important in some sectors, notably aviation.  However the IEA projections seem unlikely on a range of grounds.  For example, it is difficult to make bioenergy fully carbon neutral without CCS.  In practice demand seems more likely to be met from other sources.

The IEA presents its scenario as being for 2050.  However, the 2060s seems a more plausible timescale to reach a near zero carbon system globally, given current circumstances.  The estimates in this work are on that basis. 

Chart 1: Potential energy mixes for a low carbon system

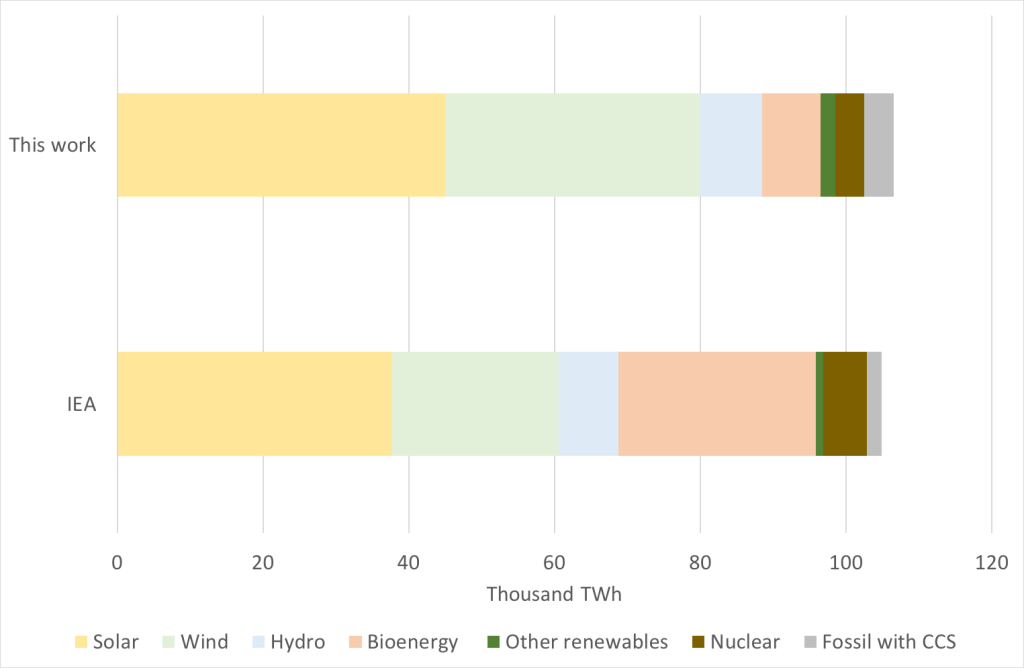
Notes: Totals here include allowance for losses due to transport, conversion (e.g. to hydrogen) and storage of energy. Solar is mainly PV, but includes a small amount of concentrated solar power.  The IEA’s scenario also includes some unabated fossil fuel use which is not included in this chart. Use of heat from nuclear is excluded from this analysis.

The transition to a low carbon system will be helped by increased energy efficiency.  Continuing growth of the global population and development of economies will put upwards pressure on energy consumption.  However, this is likely to be outweighed by major gains in efficiency from electrification, including use of heat pumps and electric vehicles.  Total final energy consumption was around 120,000 TWh in 2022.  The IEA projects this will fall to 94,000 TWh for a low carbon system.  A slightly greater decrease is included in this work, reflecting the longer time allowed for the transition.  Additional energy to meet losses is included in the chart.

Both this work and the IEA scenarios show large amounts of solar and wind[iii].  Indeed, almost any plausible scenario is likely to show solar and wind accounting for over 50% of total energy in a decarbonised system.  With more realistic estimates for biomass than assumed by the IEA, solar and wind account for around 75% of energy demand.  If, in addition, nuclear or CCS are less successful than assumed, then solar and wind would need to meet close 80% of consumption.

Although solar and wind predominate, other sources will nevertheless be important.  The global energy system is vast, so even contributions of a few percent of total consumption are financially large by the standards of most sectors (illustratively, they may be industries each generating revenue of $200-400 billion p.a.). 

Is it plausible that solar and wind could generate this much energy by the 2060s or earlier?

Developing such large amounts of solar and wind will be challenging.   Fortunately, meeting this challenge is easier because they have a number of characteristics in their favour not matched by any other energy source:

  • They are already at scale
  • They have demonstrated rapid growth to date, at or near exponential rates
  • Costs are already low compared with other forms of energy, and are reducing rapidly
  • There is potential for further scalability and standardisation, especially for solar
  • The resource base for each is very large and widely dispersed
  • Complementary technologies such as batteries and electrolysers to make hydrogen are also growing rapidly and reducing in cost

Chart 2 shows the distinctive growth pattern of solar and wind.  Nuclear grew rapidly in the 1970s and 1980s but then plateaued.  The factors that led to this, notably high costs, do not apply to solar and wind. 

Chart 2.  Growth of low carbon energy sources to 2022

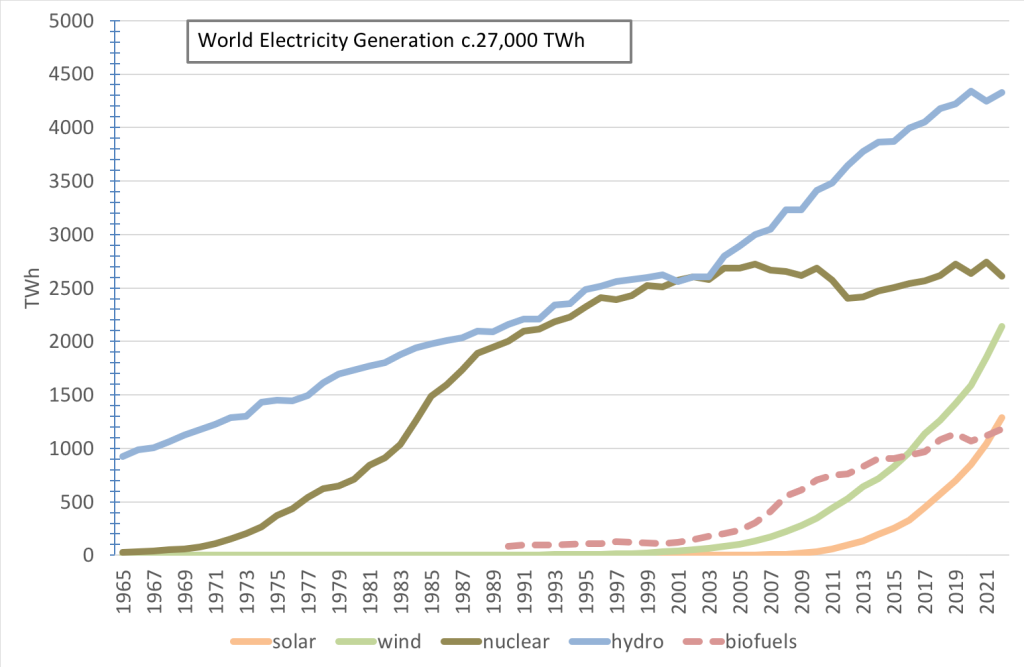
Source:  Our World in Data

Future deployment of solar and wind are modelled using a standard logistic function (s-curve).  The model fits the historic data well, although the fit is not exact and different combinations of parameters give similar results.  Growth for both solar and wind are most rapid around 2040, reaching around 2250 TWh p.a. for solar and 1300 TWh p.a. for wind.  These rates of installation are around eight and four times 2022 rates respectively. 

Chart 3. Modelled and actual generation of solar PV (World)

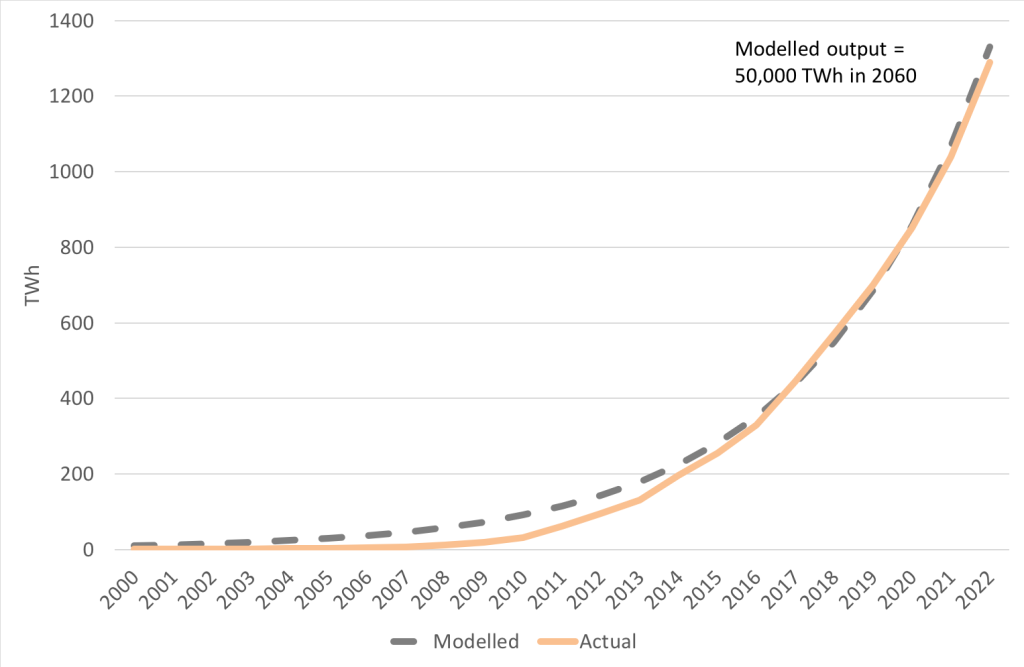
Chart 4. Modelled and actual generation of wind energy (World)

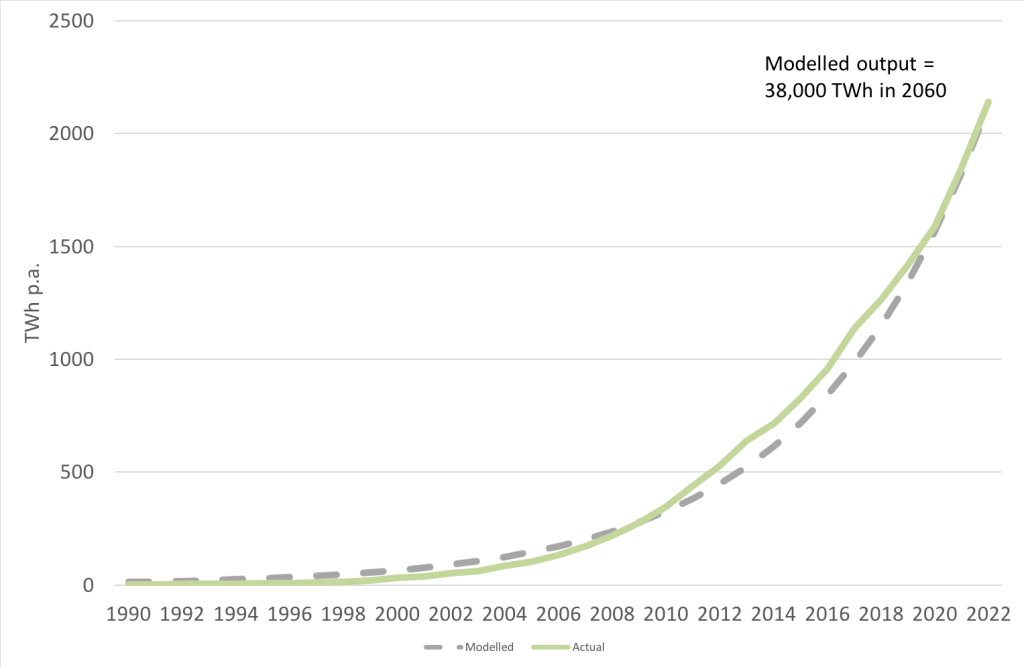
Generation in 2060 is assumed to increase to up 50,000TWh for solar and 38,000 TWh for wind, more than the approximately 80,000 TWh required to fill the gap in energy supply. 

The balance between wind and solar will depend on circumstances and costs.  In practice solar seems likely to make a somewhat greater contribution due to rapidly falling costs and continuing scalability.  In any case the combined total appears to be comfortably enough to meet demand.

Modelled growt to 2030 is similar to industry protections for both solar and wind.  For example, solar industry observers are expecting annual installation rates of 1 TW p.a. by 2030[iv].  Cumulative capacity is around 6 TW by then. This would generate about 9,000TWh p.a. compared with 7,100 TWh p.a. shown here.  Wind deployment is expected to be 2000GW, equivalent to around 6200TWh compared with 6,700TWh shown here.  Total wind and solar generation is estimated by other observers as 12,000-14,000 TWh in 2030[v], consistent with 13,800TWh shown by this modelling.

The large growth in cumulative capacity should reduce costs.  By 2050, solar costs seem likely to fall by a factor of between three and four, and wind costs by a factor of at least two compared with current costs (based on expected deployment and learning rates, and excluding temporary supply chain bottlenecks). 

Solar and wind thus look likely to be able to make the required contribution to a near zero carbon energy system.  Indeed, there appears to be additional potential for wind and solar if needed.  This might be the case if other energy sources produce less than the maximum estimated here, or if demand is higher, for example due to the need for very large amounts of storage for hydrogen, with corresponding conversion losses.

There will of course be huge challenges in meeting such ambitions targets.  But they nevertheless appear achievable.

Implications for policy

The central role of solar and wind in a future energy system means that enabling them to continue to scale is crucial.  This is greatly helped by falling costs, which increasingly make solar and wind the lowest cost choice for new energy supply.   However, there are still areas where growth implies the need for supporting policies.

  • Grids.  Large scale grid upgrades will be necessary both to transport power over long distances and to balance grids locally.  The challenges of grid expansion and upgrades are mainly political rather than technical and economic.
  • Storage, especially hydrogen, batteries and heat storage.  There is likely to be a complex set of solutions to system balancing, varying with circumstances, including demand management.  Markets to help systems balance will have an important role to play in securing innovation and efficient outcomes.
  • New technology will continue to play an important role.  In particular, more efficient solar cells and floating offshore wind are likely to help meet capacity targets.
  • Continued focus on energy efficiency to reduce energy demand, for example insulation of the building stock, will also continue to be required.

The challenge is thus huge.  But if the challenge can be met the resulting global energy system will be both better and cheaper than we have now.

Adam Whitmore – 17th April 2024

Notes

Large-scale hydro

Large-scale hydro has grown by about 2000TWh over the last two decades or so, mainly in China, to reach around 4500 TWh.  The rate of growth over this period was more than double in absolute turns that in previous decades.

However further growth is limited by the availability of sites.  A study showed a theoretical potential of up to 40,000 TWh[vi].  However, another study found exploitable potential of 16,000 TWh[vii].  Even within this total, in practice not all projects will proceed.  Extrapolating growth rates from the last two decades to cover the period to the 2060s implies generation of around 8,500 TWh.  This is taken this as a likely practical maximum.

Nuclear

Much of nuclear generation comes from aging plant built in the last quarter of the twentieth century.  Around 60% of current reactors are over 30 years old[viii], so will come to the end of their lives in the next two decades or so.  Growing nuclear generation thus requires that existing capacity is replaced and then that additional capacity is built as well.   Current capacity is 395GW, with 64GW under construction[ix].

Lead times for building nuclear plant are long.  In the OECD costs are high, as illustrated by the price of over £120/MWh today for Hinkley C in the UK.  Indeed nuclear is almost the only technology for which costs have not greatly reduced with deployment – indeed if anything costs have increased (negative learning rates). 

Small Modular Reactors may ease cost pressures somewhat but they remain at the development stage and don’t appear to represent fundamentally different technologies. 

Based on this it looks like nuclear will face a challenge growing significantly.  Examining historic growth rates and likely costs, around 4000 TWh seems the maximum plausible generation by the 2060s, compared with around 2500 TWh today. 

Bio energy

Modern bioenergy (i.e. excluding traditional biomass) accounts for around 5.1% of final energy consumption[x]

While there is much uncertainty about future availability, one detailed study has shown that there is little potential for additional use without crossing planetary boundaries[xi].  At the very least there will usually be preferable uses for land, including growing food and landscape restoration. 

Bioenergy faces other major challenges.   

  • It’s expensive, requiring subsides or mandates in most locations
  • It is essentially a highly inefficient form of solar energy, and consequently it’s very inefficient in its use of land compared with solar PV, even allowing for losses from conversion of solar electricity to hydrogen when needed.     
  • It is difficult to make bioenergy fully carbon neutral across the chain without CCS, and then only using fast rotation crops, preferably locally grown.

Furthermore, there is no evidence to date of an ability you scale at the rate that would be required to make a much larger contribution suggested by the IEA.  We assume about a maximum of about a third greater than current supply.

Smaller scale renewables

These seem likely to remain relatively small sources of power.  These technologies are generally long-standing, but have proved difficult to scale up, due to either technological or commercial barriers.  Geothermal energy will be important in Iceland and elsewhere, and seems to have the greatest potential among other renewables.  Wave has proved technically challenging as it has been difficult to provide enough robustness against storms while retaining enough flexibility to generate energy.  It’s a form of indirect wind energy, and continuing to grow direct wind energy looks more promising.  Tidal may have a role to play where tidal ranges are high, but the large amount of civil engineering required usually makes it expensive, and there are often obstacles due to local environmental impacts.

We have assumed they reach 2000TWh, about 20 times greater than today’s levels.

Fossil fuels with CCS

There is clearly no doubt that fossil fuels can provide energy at scale.  However, developing CCS has been much slower than many expected.  Very little is used for energy, and even if an amount of capture capacity equal to the current global total capture across all applications were devoted to energy from natural gas, it would only provide about 200 TWh.  It may manage to scale up, but lead times are long, especially for proving sinks.  Costs remain higher than for solar and wind and projects require large amounts of capital.

On balance, it seems unlikely that CCS on energy use it will exceed the energy from nuclear over the next few decades, and the maximum is assumed to equal that for nuclear. CCS may have more of a role to play in decarbonising process emissions.

Nuclear fusion

This is excluded from the analysis.  It remains at too early a stage to make a significant contribution over the next 50 years and the free fusion reactor in the sky (the sun) is always likely to be cheaper. 

The IEA on solar and wind

The IEA was for many years notorious for forecasting renewables deployment well below outturn.  For example, in 2012 they were projecting 23 GW p.a. of solar capacity and 34 GW p.a wind being added in 2023.  The actual preliminary figures were around 115 GW for wind[xii], more than four times greater than projected, and 440 GW for solar[xiii], nearly 20 times greater than projected.


[i] The analysis focusses on final energy consumption, with an additional allowance for losses.  This is a more useful indicator than primary energy supply, because it excludes the huge losses from fossil fuel power generation and to a lesser extent oil refining.  These will not be significant in a low carbon energy system. 

[ii] https://www.iea.org/reports/net-zero-roadmap-a-global-pathway-to-keep-the-15-0c-goal-in-reach

[iii] The two estimates differ by around 30%, which is small compared with the magnitude of the change from current levels. 

[iv] https://pv-magazine-usa.com/2022/05/16/a-fate-realized-1-tw-of-solar-to-be-deployed-annually-by-2030/

[v] https://rmi.org/press-release/renewable-energy-deployment-puts-global-power-system-on-track-for-ambitious-net-zero-pathway/

[vi] https://www.sciencedirect.com/science/article/abs/pii/S2212428422000068

[vii] https://pubs.rsc.org/en/content/articlelanding/2015/ee/c5ee00888c

[viii] https://www.statista.com/statistics/517060/average-age-of-nuclear-reactors-worldwide/

[ix] https://world-nuclear.org/information-library/current-and-future-generation/nuclear-power-in-the-world-today.aspx

[x] https://www.ren21.net/gsr-2021/chapters/chapter_03/chapter_03/

[xi] https://www.negemproject.eu/wp-content/uploads/2023/05/D-3.2-Global-NETP-biogeochemical-potential.pdf

[xii] https://gwec.net/globalwindreport2023/

[xiii] https://www.pv-magazine.com/2024/02/20/bloombergnef-says-global-pv-installations-could-hit-574-gw-this-year/#:~:text=It%20said%20that%20new%20solar,and%20722%20GW%20in%202028.

Prospects for DACCS

I have recently co-authored a report suggesting, among other things, that DACCS will remains scarce and expensive at least to 2050 and likely beyond. The report can be found here:

https://www.belfercenter.org/publication/prospects-direct-air-carbon-capture-and-storage-costs-scale-and-funding

The summary of the report is as follows.

Direct Air Carbon Capture and Storage (DACCS) has the potential to contribute to meeting long-term climate goals. An ambitious deployment scenario shows DACCS growing rapidly to remove about 400 MtCO2 per annum (p.a.) by 2050, the equivalent of a little over 1% of 2022 emissions from the energy and industry sectors, and reaching one Gigatonne p.a. of removals before 2060.

However, achieving this scale of deployment will be enormously challenging, requiring strong, long-term policy support, and commitment of very large-scale physical and nancial resources. Reaching Gigatonne scale is likely to require cumulative funding globally into the trillions of U.S. dollars. As part of this, a Gigatonne of DACCS will need 1400-4200 TWh p.a. of low carbon energy, which compares with U.S. utility scale power generation of 4240 TWh in 2022, and enough geological storage capacity to accommodate an amount of CO2 more than an order of magnitude greater than is captured each year for storage at present.

DACCS is currently in the early stages of deployment and uncertainties on costs are correspondingly large. Removals from early full-scale plants coming online towards
2030 currently appear likely to cost $400-1000 per tonne of net CO2 removed from the atmosphere. Costs may fall to around $200-400/tCO2 sometime in the 2050s if large-scale deployment is successful. However, costs towards $200/tCO2 only appear achievable if costs of early projects are towards the bottom of the expected range and there is large- scale roll-out of DACCS. Aspirational goals of DACCS costs of $100/tCO2 seem unlikely to be achieved even in the longer term. Costs of DACCS may nevertheless be below the costs of abatement in some applications.

Early deployment of DACCS is essential for reducing costs to enable timely deployment at scale. is outcome would probably best be supported by a combination of capital subsidies and contractual payments or tax credits. In the medium to longer term, removals may realise value by inclusion in emissions trading systems.

The challenges of implementing DACCS at very large scale further emphasise the need for urgent and widespread action to reduce emissions, which should continue to be the main priority for meeting climate goals. Such action includes decarbonisation of electricity grids and, where appropriate, use of CCS with high capture rates for industrial emissions.

Adam Whitmore – 8th December 2023

Advantages of enhancing the Auction Reserve Price in the UKETS

The current design of the UK Emissions Trading System (UKETS) includes an Auction Reserve Price (ARP) for allowances, set at £22/tCO2.  This effectively establishes a minimum price, or price floor.  The Government is now considering potential changes to the UKETS, including whether the ARP should be replaced with another mechanism, kept in its current form, or abolished. 

Advantages of including a price floor within the design of an ETS have long been recognised.  It has clear benefits when compared with a simple ETS, which allows prices to fall to any level.  A floor can remedy the risk of carbon prices which are too low to adequately incentivise investment necessary to meet targets, including net zero, and too low to reflect the environmental damage caused by emissions.  Although there is uncertainty about the appropriate level for a floor, the absence of a defined floor in effect sets the price floor at zero, which is certainly the wrong level.

Further advantages of a price floor are now becoming apparent as policy evolves.  In particular, contracts for difference on the carbon price (CCFDs) are now widely discussed as a mechanism for supporting low carbon investment, with some steps towards implementation, for example in supporting CCS in the UK.  Under a CCFD a carbon price floor can eliminate the risk to governments of larger payments under the CCFD due to very low carbon prices. 

Benefits of price floors accrue to a range of stakeholders.  The major types of benefits are summarised below.  The advantages largely apply whether the price floor is in the form of an ARP or a top-up tax, as used in the Netherlands, but with some differences in detail, as noted.  

In all cases the benefits from stability and reduced risks are much greater if the price floor is specified in advance for a number of years. 

Benefits to investors in low carbon technologies

Reducing costs of abatement by providing greater certainty for investors.  A minimum carbon price can support investments in low carbon technologies by reducing or eliminating the risks that carbon prices will be low, and that investments will consequently be unprofitable.  This reduction in risks can facilitate the financing of projects and so reduce the cost of capital.  This will in turn reduce the overall costs of investment.  These effects are widely recognised by policy makers.  For example, the European Commission has stated that a stable carbon price signal is one of the elements that can improve the investment climate for low-carbon investments.   Long investment cycles imply stability is needed over longer periods than the current ARP.

Increasing expected average carbon prices.  A floor on the carbon price removes the lower part of a price distribution.  Other things being equal, this will increase expected average prices.  A price floor thus makes the price both less volatile, and so less risky, and higher on expected average.  This will in turn stimulate additional investment.  In contrast a price ceiling makes the price less volatile but lower on average.

Greater political stability for the UKETS.  Reduced price volatility and reduced risks for both investors and government may help sustain the political acceptability of the system, and reduce the need for ad hoc, unpredictable changes or interventions.  This will further reduce risks for investors.

Benefits for government

Providing more stable government revenue from allowance auctions.  Low prices can lead to low auction revenue for governments, and potential disruption to funding to government spending programmes.  In contrast, with a price floor government auction revenue is unlikely to fall to very low levels (unless very many auctioned allowances go unsold).  The risk under an ARP that allowances will be unsold does not occur with a top-up tax.

Reducing risks for governments of high payments under carbon contracts for difference (CCFDs). CCFDs are planned to provide used to support for low-carbon technologies, including CCS, in both the UK and EU.  Low allowance prices could lead to large payments by the government under CCFDs. A price floor prevents this, and so protects the government against higher expenditure.  This may in turn enable a greater volume of CCFDs to be issued, with consequent increases in the deployment of low carbon technologies. 

Making sure that low cost abatement is incentivised.  If prices can go to low levels there is a risk that emissions reductions will not be incentivised, even if they are clearly cost-effective (with environmental benefits greater than the cost of abatement), and clearly needed as part of a comprehensive programme of emissions reductions.  A price floor avoids these risks, providing a clear signal to investors to undertake low cost investments.  This reduces the overall costs to the economy of meeting carbon budgets.

Benefits for consumers

Reducing bills for consumers.  Lower costs for technologies, and signalling investment in low cost abatement from a price floor will reduce the costs of the transition to low carbon energy system.  This will in turn benefit consumers in the form of lower bills from lower prices, and reduced consumption through greater energy efficiency.

Benefits for the climate

Reducing cumulative emissions by cancelling unsold allowances.  If allowances are unsold at the auction reserve price they may be cancelled, reducing supply and tightening the cap.  This mechanism does not apply to a top-up tax, where the number of allowances is not directly affected. 

Reducing emissions by enabling more ambitious targets to be set. Reducing the costs of low carbon investment can enable future caps to be more ambitious, and thus to secure further environmental benefits in future.  Both an auction reserve price and a top-up tax can reduce future emissions in this way.  

Protecting consumers from price rises

Carbon prices may in some cases be higher with a floor.  This may in turn raise prices to energy consumers.  The effect of a price floor on residential consumers’ bills is small – typically around a hundred times smaller than current wholesale energy price increases in the absence of government action[i].  However, any concerns about higher prices for residential or business consumers can be readily addressed simply by modifying or extending existing and prospective solutions.  This includes the following.

  • Allocating allowances free of charge or introducing Carbon Border Adjustment Mechanisms can continue to reduce the risks of carbon leakage for emissions intensive trade exposed industry.
  • Direct financial compensation to electricity consumers is in place for some consumers and could be readily extended, for example by using auction revenue to further compensate customers or to fund energy efficiency measures. 
  • Moving away from marginal cost pricing in wholesale electricity markets would reduce the extent of the effect of carbon prices, as renewables and nuclear do not incur any allowance costs in any case.

The advantages of an enhanced and extended ARP are compelling.  UKETS needs not only to retain the current floor, but also to strengthen and extend it.

Adam Whitmore – 27th September 2022


[i] For example, if the price floor leads to carbon prices £23/tCO2 higher than they would have been and full marginal cost pricing were retained in electricity wholesale markets (both of which currently seem unlikely), with typical electricity consumption of 2.9MWh p.a. then each consumer’s bill would increase by around £27p.a., about 1% of the currently expected increase in bills for 2022/3 in the absence of government intervention. 

Approaches to risk of reversal for Carbon Dioxide Removal

Different types of carbon dioxide removal differ greatly in the extent to which they are permanent.  The risk of reversal, with release of CO2 into the atmosphere, is always present for land-based sinks and other types of removal based on short duration carbon cycles.  In contrast, removals to geological storage are largely permanent.  These differences can be recognised in different ways.

The removal of carbon dioxide from the atmosphere (Carbon Dioxide Removal – CDR) is widely acknowledged as having an essential role to play in reducing climate change[1].  It is essential for balancing emissions that are hard to abate, such as some from agriculture and long-haul aviation.  Beyond that, it is essential for eventually reducing atmospheric concentrations of CO2 through net-negative global emissions.

However, securing the full climate benefits of removals requires that they are permanent and irreversible over very long timescales.  Climate change depends, broadly, on the cumulative emissions of CO2 to the atmosphere[2].  Delaying emissions through absorption and subsequent release of CO2 does little to change eventual cumulative total.  (Nevertheless, there may be some benefit to temporarily reducing atmospheric concentrations, especially if this reduces or delays the peak in concentration of carbon dioxide in the atmosphere.  This benefit may be relevant to assessing policies in some cases.)

Methods for CDR have very different risks of reversal.  For geological storage, part of very long carbon cycles, the risk of reversal is very low, and permanence can be largely guaranteed.  In contrast, terrestrial sinks such as forests, which are part of a much shorter carbon cycles, risk substantial reversals over years or decades[3].

Removals to geological storage and land-based sinks also have quite different properties in other respects.  Some of the main differences are summarised in the table. 

Table: Characteristics of different types of carbon dioxide removal from the atmosphere

Type of storageCapture from air for geological storageCapture from air inn terrestrial sinks
Length of carbon cycleLong (Many millennia to millions of years)Short (Decades or centuries)
Risk of reversalVery lowModerate to high
CostHigh to very high at present but with substantial scope for reduction.Low to medium in short to medium term (allowing for some benefits being distant in time because, for example time taken for trees to grow).  However long run MRV costs and need for permanence may greatly increase costs.
ScaleCurrently small – about three decades or more likely needed to reach Gt scaleReadily scalable
Requirement for continued management and MRVLowModerate to high

This creates a challenge in comparing the value for reducing climate change of different approaches to CDR.  This post briefly considers three different approaches to addressing this challenge.  The approaches are not mutually exclusive.  A fuller account can be found here.

Approach 1:  Separate treatment of long and short cycle removals

Under this approach differences are explicitly recognised.  Policy and incentives are largely separate for the different broad types of removal.  Among other things, use of land-based removals may be restricted to balancing land-based emissions.  They would not be eligible for balancing emissions of fossil carbon.  This is illustrated in the Figure 1.

Source:  Bellona

Approach 2:  short cycle removals discounted by a probability weighting

Under this approach, the cumulative probability of reversal set in advance by regulation is used to scale number of removal credits surrendered to meeting obligations, creating an “exchange rate” between different types of credit.  For example, a 25% risk of reversal requires 1.33 credits (“risk adjusted tonnes”) to be surrendered to balance a tonne of emissions.  Calculation of the risk of reversal takes into account estimates of the future direct and indirect effects of climate change, and risks arising from policy and management, ownership, and governance of projects.  This is illustrated in Figure 2.

Source:  Bellona

An additional buffer or safety margin may be built to recognise uncertainties in the estimates of probabilities.  For example, assessment may be based on confidence intervals of a distribution rather than the mean.  Removals with a risk of reversal above a certain threshold could be deemed ineligible.

Under this approach the effect of the scaling parameter on credit value is clear.  However it gives limited incentives for subsequent management, as the probability of reversal is set in advance.  It is also potentially administratively quite burdensome if calculations are specific to detailed project characteristics (e.g. tree species), location and jurisdiction.  Furthermore, the concept of probability based on an average outcome may not be robust to risks correlated across very large numbers of projects, for example mass dieback of forests.

Approach 3:  Credits are required to be “permanent equivalent”, with an obligation to replace reversals

Under this approach, credits for removals carry an obligation to make good any reversals at the time the reversal occurs, by creating or buying credits to match any reversals.  This obligation continues in perpetuity.  There is no buy-out available from simply paying a carbon price.  This is illustrated in Figure 3.

Source:  Bellona

Holders of credits must demonstrate they have the means to meet this obligation, for example through an insurance policy or funds held in escrow.  Government may have a role here due to uninsurable risks.

The price of a credit would reflect the cost of the storage project, cost of insurance or funds held, and continuing MRV costs.  It would thus be set by markets (at least in part).  The equivalent of ratings for bonds may emerge over time for different types of credit.

This approach uses market mechanisms to reveal the value of different types of credit, while ensuring permanence.  It creates direct incentives to manage stores of carbon, and potentially covert to permanence, for example via Bioenergy with CCS (BECCS).  However, continuing MRV is potentially costly.  There may also be an unwillingness among private sector parties to take on the required risks, reducing the supply of credits.  This would nevertheless case reveal information about risks.

Ways forward

It is essential for good policy that the different risks of reversals for different types of carbon dioxide removal are recognised, and that policy takes account of them.  This note outlines some possible approaches to this.  In considering each of these, the real value of permanence of removals in limiting climate change needs to be recognised.

Adam Whitmore – 26th April 2022


[1] See for example IPCC, 2018: Global warming of 1.5°C. An IPCC Special Report

https://www.ipcc.ch/sr15/download/

[2] https://www.ipcc.ch/report/ar6/wg1/

[3] Similar reasoning applies to some man-made sinks, for example buildings.

Increased interconnection is part of transforming Great Britain’s electricity market

Until recently the UK’s electricity market was relatively isolated from the wider continental European market.  This is now changing as interconnector capacity expands rapidly.  This has significant benefits but also raises challenges. 

Throughout the 1990s and 2000s the UK had only 2GW of electricity interconnection with continental Europe, about 3% of peak system demand[i]. (See chart – 0.5GW megawatts of interconnection to Northern Ireland was added in 2002).  In 2011 the Britned interconnector with the Netherlands opened, providing and additional 1GW of capacity, with a further 0.5 GW to Ireland in 2012.  This situation persisted until 2018.  Interconnection to continental Europe (that is excluding Ireland) remained only 5% of peak Great Britain demand. 

This has since changed rapidly.  Total capacity has more than doubled to 8.4 GW today, with further capacity to France and Ireland, and links to Denmark and Norway added.  This expansion looks set to continue with a number of further projects planned. I have marked these in dashed lines on the chart, with timings illustrative only. The UK’s National Grid expects total electricity interconnector capacity to reach between 16 and 22 gigawatts by 2030, with further expansion thereafter.  Capacity will thus grown by a factor of four to five in just over a decade or so.

Chart: Development of Great Britain Electricity Interconnection

Source: Ofgem[ii]

This increased interconnection has a number of advantages.  

  • It helps balance a system that has increasing amounts of variable renewable generation. In particular it should help accommodate the large amount or offshore wind capacity expected on the GB system, where the government has set a target of 40GW of offshore wind by 2030. The interconnection with Norway, with its largely hydro based electricity system, seems likely to prove especially valuable in this respect.
  • It allows demand to be met from the lowest cost source of supply. 

Modelling of the UK Power system in 2035 shows a significant likely role for interconnection in balancing the system[iii].

However it also raises significant challenges.  

  • Market distortions may be introduced if carbon prices differ between jurisdictions, especially over the next decade or more before the GB system is fully decarbonised. Electricity may be produced where the carbon price is lower, even if emissions from that source are higher. It remains unclear how closely prices under the UK ETS and EU ETS will match over the next few years. 
  • Similar concerns arise over the role of incentives for new low carbon power, which will be essential but have the potential to create distortions.
  • If some UK demand is met by imports it may be unclear if these come from low carbon sources. The UK and EU have the same target date of 2050 for net zero across the economy.  However the UK also has a separate target for decarbonising the power sector by 2035, which the EU does not.  The UK may thus meet its net zero targets in part by importing high carbon power from elsewhere in Europe in 2035. While this is consistent with many other goods, where embodied carbon does not count towards carbon targets, it nevertheless is a point of concern and something that policy should seek to avoid. 

The growth of interconnect capacity is welcome.  It should allow higher proportions of variable renewables to be accommodated on the system at lower cost.  However there are several ways in where policy could distort markets and lead to unintended consequences.  These need to be addressed if the growth of interconnector capacity is to maximise its benefits for the climate. 

Adam Whitmore  –  18th January 2022 


[i] Based on 2005 peak demand of 62GW in 2010 and projected peak demand of 65-69 GW in 2030.   Source National Grid Future Energy Scenarios 2021 https://www.nationalgrideso.com/future-energy/future-energy-scenarios/fes-2021/documents

[ii] https://www.ofgem.gov.uk/energy-policy-and-regulation/policy-and-regulatory-programmes/interconnectors

[iii] https://www.imperial.ac.uk/energy-futures-lab/reports/white-papers/net-zero-gb-electricity/

Leaving a legacy to remove lifetime emissions

People born in previous decades have much higher lifetime emissions than those born today.  They should be encouraged to redress this by financing carbon dioxide removals as part of their legacy.

Climate change is widely acknowledged to raise substantial intergenerational equity issues.  Those born in earlier decades have produced many of the emissions leading to climate change.  But those born today will experience much greater damage.   This is especially true in the UK, where reductions in per capita emissions mean that previous generations have been responsible for much greater emissions over their lifetimes than will those born in recent years. 

This can be seen by looking at emissions per capita from the UK over time. (Throughout this post I refer to territorial emissions rather than consumption based emissions, data for which would anyway unavailable – see here for more on the two approaches.)  Chart 1 shows per capita emissions over time starting in 1800, shortly after the start of the industrial revolution.  Per capita emissions rose strongly in the 19th century, surpassing current levels around 1860. They remained high through most of the 20th century, beginning to decline from around the 1980s, and continuing to decline sharply this century. 

Chart 1: Per capita CO2 emissions in the UK since 1800 (ten year average)

Source: World Bank[i]  

Notes:  Data is an average over the following decade, so the figure for 1800 is the average of emissions from 1800 to 1809. Data for 2010 is an average of 2010 to 2019. Data going back over 200 years is clearly subject to large uncertainty, but here we are concerned with the broad levels and trends.  

The implications of this for emissions by those alive today can be seen more clearly by focussing on the last 80 years or so.  For the first half of this period (1940-1980) CO2 emissions remained between about 10 and 12 tonnes per capita. But they have since declined, roughly halving by 2019 relative to the first half of the period.  The UK’s legally binding obligation to reach zero by 2050 means this trend is set to continue.

Chart 2: Per capita CO2 emissions in the UK 1940 to 2020

Notes: data is as above, but annual rather than moving averages.

This means that different generations are on average responsible for different levels of emissions over their lifetimes. Chart 3 shows total lifetime emissions for an individual by year of birth, assuming that their emissions are equal to the national average in any year.  Someone born in 1940 would have average lifetime emissions of around 900 tonnes. This falls steadily over time so that someone born in 1980 would have lifetime emissions of around 400 tonnes.  Someone born today would expect total lifetime emissions of less than 100 tonnes, a factor of nearly 10 times less than someone born 80 years earlier.  Older people have thus on average contributed more to climate change, yet it is the young, and those yet to be born, who will mainly suffer the effects of carbon emissions. (These are averages with important exceptions – for example someone born in recent decades who takes a lot of flights will have higher emissions than even someone quite wealthy in previous generations.)

Chart 3: Indicative average lifetime emissions by year of birth

Note: Emissions are assumed to fall to net zero by 2050 and remain at that level thereafter. I have not assumed net negative emissions after 2050.  I have assumed a constant 80 year life span, ignoring changes in life expectancy. Again I am concerned with broad trends here, and this simplification makes little difference to the pattern. For example, for those born today an extended life will not add to lifetime emissions and may even reduce them, because emissions are assumed to be zero in the additional years, and negative emissions may reduce them further. 

There are clearly some qualifications to the conclusions from this analysis.  First, many of the people in the older groups would have spent much of their lives unaware of the harm to the climate due to emissions from burning fossil fuels.  It is only in the last 40 or 50 years or so that the effects on the climate of manmade emissions has become well established and well known science. Second, they were in any case largely powerless to eliminate the emissions.  For example, most would have had no control of the electricity generation mix or the use of fuel in industry.  Third, many of those born earlier have been poorer for those born today over their lifetimes, though not in all cases and not necessarily the young of today compared with their parents[1].

Nevertheless, the analysis clearly raises questions of whether those whose lives have led to higher emissions should be encouraged to redress the damage, provided that they can afford to do so. Similarly, the rich will typically emit more than the poor, so the cases for redress is stronger.

In practice is likely best done by some sort of carbon dioxide removal.  This most likely to be in the form of land use, engineering approaches to direct air capture Direct Air Capture being prohibitively expensive in this context and not yet available at scale.  Reforestation and rewilding in the UK seems a natural place to start, providing that there are appropriate quality thresholds and safeguards, including around permanence.  (For transparency I should say that around 10-15 years ago I balanced my own estimated lifetime emissions by financing an equivalent amount reforestation and rewilding in Scotland, with some safety margin built in.)

Indeed several reputable organisations already enable people to pay for planting trees to absorb emissions[ii]. The link may be explicit or implied.  For example, one organisation explicitly offers the ability to offset lifetime emissions by planting a single giant sequoia, which is large enough to absorb one person’s lifetime CO2[iii], although, as they acknowledge, it takes around two and a half centuries to do this, so it does not balance the effects of emissions now.

However, it is likely to prove challenging to get most people to spend money on this.  Even many better off older people are worried about their finances, especially the costs of care in later life.  And the sums involved are potentially not trivial – perhaps £10,000 depending on the cost of a particular project – although much smaller than other costs people might have to bear.  However there are various mechanisms by which this could be made easier.

One possible mechanism is to make use of assets remaining at the end of life, including by enhanced incentives under inheritance tax.   Charitable donations can already qualify for exemptions from inheritance tax.  People could be further encouraged to fund high quality reforestation and rewilding projects by granting additional incentives under inheritance tax rules.  This seems both in the spirit of it leaving a legacy for the future, something many people already try to achieve with bequests, and consistent with government policy objectives. 

Older people have contributed to climate change, although often unwittingly and in ways largely outside their control.  Providing incentives to give some of any accumulated wealth to redress damage look to be a worthwhile goal for public policy, and appears likely to be something many older people concerned for their grandchildren’s future would welcome. 

Adam Whitmore – 15th December 2021


[1] This is especially true looking at wealth rather than income, where many older people have benefitted from rises in asset prices.


[i]See  https://ourworldindata.org/co2-emissions, https://www.macrotrends.net/countries/GBR/united-kingdom/carbon-co2-emissions

[ii] For example https://www.nationaltrust.org.uk  (£5/tree) and https://treesforlife.org.uk/ (£6/tree) There are many junk offsets arounds also, which would be excluded from the type of system I am suggesting here.

[iii] https://onelifeonetree.com/  They estimate 1400 tonnes has been absorbed by the General Sherman, the world’s largest tree, over its life. 

The UK rightly deprioritises early CCU

The UK government has decided that CCU projects should not be eligible for early rounds of industrial CCS projects support contracts.  This looks like the right decision.

Carbon capture and use (CCU) is an appealing concept in some respects.  Carbon capture and storage (CCS) adds the costs of transport and geological storage to the costs of capture. In contrast, CCU is intended to make captured CO2 a valuable product, replacing costs with a revenue stream.  The main use of captured CO2 to date has been for enhanced oil recovery (EOR) in North America.  In the UK, including there is a range of potential applications including making building materials, lime, food and drink and e-fuels.  CCU may be particularly attractive for capture sites away from large industrial clusters that have limited access to transport and storage.

Some CCU projects, for example, aggregates manufacture, result in the permanent abatement of CO2, where the carbon is permanently stored in the product and not subsequently released.  However many CCU projects, including food and drink and e-fuels, lead to only the temporary abatement of CO2, as the carbon is ultimately emitted to the atmosphere.  The latter are not compatible with reaching net zero emissions.  EOR also leads to new emissions.  The CO2 injected into the reservoir to drive out additional oil stays there, or can be almost completely recovered and reinjected. However the additional oil recovered will typically be burnt without capture, creating additional emissions (although this may only displace other oil).  

CCS and CCU are intended to play a role in the UK reaching net zero.  In this context, the UK government has envisaged supporting CCU when it results in the permanent abatement of CO2 emissions, excluding use where CO2 eventually returned to the atmosphere.   

However further work has led the government to conclude that, although some forms of funding may be available to CCU, only CCS projects will be eligible for support under the industrial carbon capture business model, which provides support contracts for projects[i].

 They give three reasons for this.

The need to gather more evidence

They suggest that further evidence is needed on the market potential and costs of CCU to understand what barriers the market faces, the detailed technical application of CCU, the technological and commercial readiness, and the economic potential of CCU. They note that until these issues are understood, there will be uncertainty over what form of government support is the most suitable for CCU projects.

Additional commercial and technical complexity

The application of CCU could involve additional commercial and technical complexities to the business model that would need to be worked through in detail before support is provided. For example, the business model would need to take into account a number of considerations specific to CCU projects, including the revenues gained if the CO2 captured is sold, and monitoring the end-use of CO2 to ensure the captured carbon is permanently abated.

Prioritising support for the deployment of CCS

There is a focus on incentivising large-scale abatement of CO2 and the establishment of transport and storage infrastructure essential for net zero. CCU resulting in the permanent abatement of CO2 potentially represents only a very small abatement potential when compared to CCS.

Essentially the overall view is an argument that:

  1. Only CCU projects that result in CO2 being kept permanently out of the atmosphere should be eligible for support
  2. These are too small as a proportion of total emissions to merit the additional effort and complexity they would lead to at the moment.

Both these arguments seem sound.  The first point will always apply.  On the second, those CCU projects which include permanent abatement may be worthwhile at a later date.  But for now the focus should be on getting large scale CCS projects built.

Adam Whitmore – 23rd November 2021


[i] https://assets.publishing.service.gov.uk/government/uploads/system/uploads/attachment_data/file/1023095/icc-business-model-october-2021.pdf

Defining low carbon electrolytic hydrogen

Hydrogen made by electrolysis is only low carbon if made when there is surplus low carbon generation on the system.  This will likely become much more common in future. Deployment of electrolysers in the meantime should focus on developing capacity for future deployment, for example by developing electrolysers capable of running flexibly.   

The UK government recently consulted on defining a standard for low carbon hydrogen[i].  Similar discussions are taking place elsewhere, including in the EU.  However these discussions have generally failed to deal adequately with the problems associated with diverting scarce renewable electricity to make hydrogen.

Using renewable electricity to displace fossil generation achieves much greater emissions savings than making hydrogen by electrolysis, and is much cheaper.  Using renewables to displace gas in power generation leads to around two and a half too three times the emissions savings from making hydrogen to displace natural gas in industry, either in boilers or direct combustion (see my previous post for more comparisons of this type). This because of:

  • The energy losses in making hydrogen.
  • The lower efficiency with which gas is used in power generation (and thus the greater gains from displacing it).

This is shown in simplified form in the chart below.

Charts 1:  Comparison of emissions avoided by displacing electricity from natural gas in CCGT and in heat for industry

Abatement using hydrogen to reduce emissions is also much more expensive per tonne of emissions reduction.  This is both because of the cost of making the larger amount of renewable energy required per tonne of savings, and the cost of the electrolysis.  These comparisons will not change fundamentally as technology improves.  For example, electrolysis will always be an additional cost.

This implies that diverting renewable electricity to make hydrogen increases both emissions and costs.  

In practice, renewables will be diverted as long as there is fossil generation on the system.  This is almost always the case at present.  Low carbon electricity (nuclear and renewables) is low marginal cost, so will almost always run at full capacity ahead of higher marginal cost gas plant.  Consequently, when an electrolyser is switched on, the additional demand leads to additional natural gas generation, because there is no unused low carbon generation available to run.  Correspondingly, when an electrolyser is switched off natural gas generation is reduced.  The emissions from the electricity used in hydrogen production are therefore those from a natural gas plant.

The relevant consideration is thus the marginal plant on the system – the additional plant that runs when electrolyser is switched on.  One implication is that reducing grid average carbon intensity at any point in time does not change the emissions from hydrogen production while natural gas plant is at the margin.  For example, whether the system is running at 50% or 75% low carbon power, additional emissions will still be caused by switching on electrolysers. This is illustrated in the chart, which shows additional demand from electrolysers must be met by additional high carbon power, when there is no surplus of renewables.

Chart: Running electrolyses increases generation from high carbon power

Calling renewables for hydrogen additional, signing PPAs, looking to guaranties of origin, and similar measures do not change this physical reality.  Renewables are still diverted from displacing fossil generation.  For example, it is sometimes specified that renewables for hydrogen production must be “additional” for hydrogen to be low carbon.  However “additional” renewables for hydrogen manufacture still suffer the same problems, because even if labelled “additional” renewables still diverted from other potential uses. The electrolyser can be switched off and the renewables used to displace fossil generation on the grid. 

Even when there is a grid constraint or lack of grid connection it will usually be much cheaper, and yield much greater emissions savings, to rectify this than to make hydrogen. These circumstances will be rare in any case. Most new renewable electricty in the UK will be offshore wind, so will have good connections to the onshore grid.  Furthermore, electrolysers are unlikely to be situated far from the, grid as they will need to be close to centres of hydrogen demand, for example powering fuel cell buses or industry.  Indeed creating standards based on lack of grid connection risks creating perverse incentives to disconnect from the grid.

Provision of a PPA does not materially change the situation.  The PPA is financed from the support contract with funds from the government.  Financial support for hydrogen could instead be used to build extra offshore wind capacity directed to decarbonising the grid. (This would not apply in the same way if hydrogen production were unsubsidised, and in that case a genuinely additional supply of renewables may be created.) And funds freed up from avoiding the other costs of producing hydrogen can be used to fund yet more renewable capacity, further increasing the benefits. 

There are several ways in which additional renewables could be sold into wholesale markets.  For example:

  • Funds could be spent on developing new renewables to serve wholesale markets rather than electrolysers – recognising the greater value this has for abatement.
  • Selling power from the electrolyser PPA into the grid.  It may be possible to prevent this by terms in the contract, but this would not be justified on emissions savings or cost grounds.

When there is surplus low carbon electricity, for example because there is a large amount of generation from wind when demand is low, there will be little no natural gas generation on the system.  In this case switching of electrolysers will absorb this surplus without leading to additional natural gas generation.  The hydrogen is then genuinely being made using low carbon power.  This situation is currently rare but expected to be much more common over the next decade or so.

The reality is that making hydrogen from electricity is only low carbon when there are surplus renewables on the system.  At all other times there will be additional natural gas-fuelled generation as a result of the hydrogen being made.  This point was made in a recent report by respected consultants Element Energy:

“To be truly using renewable electricity, the electrolysers must not be diverting existing renewable electricity production from other sources of demand. Electrolysis performed using curtailed renewable generation is zero carbon.[ii]

 A low carbon standard should recognise this.

Furthermore, policy choices should be made in the light of this reality. They should focus on enabling deployment at scale in the 2030s (and perhaps late 2020s) when there will likely be significant amounts of surplus renewable electricity.  Any investment in electrolysis in the meantime should recognise that electrolysers currently increase emissions, and are justified only as part of a pathway to future use.  For example, there will likely be a large scale demand for electrolysers that can run flexibly enough to take advantage of periods of surplus renewable electricity.

The priority for both reducing costs and increasing emissions savings must always be to use renewables to displace fossil fuels in power generation.  Renewable electricity should not be diverted to making hydrogen.  The only exception to this now should be deployment of electrolysis to develop technologies and infrastructure necessary to enable future deployment at scale.  This recognises that the hydrogen produced is high carbon, but regards this as a necessary investment to serve future needs.

Adam Whitmore – 27th October 2021 


[i] https://www.gov.uk/government/consultations/designing-a-uk-low-carbon-hydrogen-standard

[ii] http://www.element-energy.co.uk/wordpress/wp-content/uploads/2021/08/Zemo-Low-Carbon-Hydrogen-WTT-Pathways-full-report.pdf

Prioritising use of renewables

Using renewables in different ways produces very different emissions reductions. 

Use of renewables will be central to decarbonising most parts of the energy system.   But the amount by which each MWh of renewables reduces emissions varies greatly across sectors and applications.

This is illustrated in the chart below.  It shows the number of tonnes of emissions reduction from using 1MWh of renewables in various ways. The Climate Change Committee (CCC) has produced similar estimates (see end of this post), although for a slightly narrower range of uses. 

There is clearly significant variation around each of these values.  Estimates depend, for example, on efficiency of a fossil fuelled power plant, or the emissions from the petrol or diesel car that is being displaced by an EV.  And there may be changes over time as technologies improve, although some of these technologies are limited by the fundamentals of their processes.  Nevertheless, the broad picture is likely to remain similar. 

Chart:  Emissions savings from using 1MWh of renewables for various applications

Note:   The use of renewables will usually focus on electricity but in some cases may include a component of renewable heat. 

The chart shows that directly replacing fossil fuels (coal and gas) in power generation is highly effective in reducing emissions. Coal will be eliminated from power generation in the UK by 2025, but some UK renewables may displace coal plant elsewhere if exported, so coal in power generation is included on the chart.  Highly efficient end use applications, such as heat pumps and electric vehicles, also deliver large reductions per MWh. Carbon Capture and Storage (CCS) is an especially effective use of energy, because the energy is dedicated to capturing and permanently storing CO2 from flue gases, although there are of course other costs. 

Other applications of renewables are less effective.  Replacing natural gas with electricity for industrial heat, making “green” hydrogen by electrolysis for use in boilers, and Direct Air Carbon Capture and Storage (DACCS) all achieve smaller amounts of emissions reduction per MWh of renewables.  Least effective of any of these approaches is the manufacture of e-fuels, where green hydrogen is combined with CO2 to make liquid hydrocarbons using renewable electricity.   Making e-fuels results in up to thirteen times less emissions reduction per MWh compared with the other options. 

Implementing options producing less abatement per MWh risks diverting renewables away from those that produce more abatement, hampering overall emissions reductions efforts.  This risk applies for as long as availability of renewables is limited, which seems likely to be the next couple of decades at least given the vast scale up of renewables deployment that is needed (see previous post).

Those options to the right of the chart will require very abundant, and preferably very cheap, renewable energy if they are to make a significant contribution to total emissions reduction.  This is still many years away, and most likely to be where there is a good solar resource, though economic e-fuels production still seems likely to be some decades away at best.  Among other things there are limits to efficiency gains in e-fuels manufacture – making hydrogen then combining it with carbon dioxide to make fuel is intrinsically energy intensive.

A complementary perspective to Marginal Abatement Costs

This perspective is a useful complement to looking at cost per tonne of abatement, usually summarised in a marginal abatement cost (MAC) curve.  A MAC curve is a valuable guide to where there are low cost opportunities available, although policy needs to focus much more widely than on the cheapest abatement.  However, technological progress can lead to abatement costs falling over time, as for example they have spectacularly in the case of solar PV over the last ten years.  Furthermore, interactions across the system may change feasibility, costs and practical scale of available options. A variety of perspectives can help understanding the possible effects of changes, and so can contribute to mapping out more robust pathways and identifying the likely contributions of different options.

The perspectives anyway often indicate similar conclusions.  A high renewables requirement is reflected in high abatement costs.  Estimates of abatement costs are typically £550-1200/tCO2[i]or more for e-fuels, an order of magnitude more than CCS, at around £60-100/tCO2[ii]

Specifying “additional” renewables does not remedy the problem of high renewables use

In apparent recognition of this problem of diverting renewables from more productive abatement, it is sometimes specified that renewables for some applications must be “additional”.  However “additional” renewables still face the same issues, because they still divert renewables from other potential uses. Any funds used to build renewables for less effective abatement could instead be used to build renewables for more effective abatement.

What about surplus renewables? 

There may increasingly be times when electricity demand is met entirely from nuclear and renewables, and there is surplus low carbon power on the grid.  This may imply that all available sources of demand for renewable electricity have been fulfilled.  The surplus low carbon electricity could be applied in various ways.  However there will still be choices to  be made, because there will be alternative uses for the (limited) surplus on the system.

Can’t this all be left to the (carbon) market to sort out?

Many of these issues can be addressed to some extent letting by carbon markets do their job of finding least cost abatement.  However at present many technologies are at an early stage, and subsidies for early deployment are in place or planned.  In the UK these include contracts for industrial CCS, contracts for low carbon hydrogen, contracts for renewable electricity, a mandate for renewable fuels in surface transport and a mandate for sustainable aviation fuels.  Such measures have a strong rationale in principle, because carbon markets alone will not produce adequate deployment of new technologies.  However deciding which technologies to support and by how much inevitably means choices need to be made, and the sort of analysis presented here can be useful in helping form such judgements.

Carbon markets have a crucial role to play.  But early stage deployment requires a range of factors to be addressed in deciding where support for new technologies is best directed.  This should include the quantity of emissions reduction using renewables.

Adam Whitmore – 27th September 2021

Analysis by the CCC

The UK’s Climate Change Committee (CCC) has produced similar estimates to those presented here, though covering a somewhat smaller range of options[iii].  The relative performance of the options and the approximate savings are similar in the two pieces of analysis.  However the analysis in this post indicates somewhat less abatement per MWh in many of the cases, which appears to reflect more cautious assumptions.  

Notes


[i] Costs are currently highly uncertain due to the variety and early stage of development of the technologies.  Early stage estimates for other technologies have often been subject to appraisal optimism, understating the costs of early projects.  A recent article in Nature Climate Change included estimates of €800–1200/tCO2 at present.  https://www.nature.com/articles/s41558-021-01032-7?proof=t Other cost estimates show a range of e-fuel costs of £2000-4000/tonne, which is approximately £550-1100/tonne CO2 reduction. https://www.transportenvironment.org/sites/te/files/publications/2017_11_Cerulogy_study_What_role_electrofuels_final_0.pdf   ICCT estimates e-fuels costs of at least €3-4/litre by 2030 (approx. €3750-5000/t).  The potential for cost reduction is strongly dependent on the costs of the renewable energy needed for manufacture. 

[ii] CCS costs vary significantly because projects differ greatly, for example in the concentration of the CO2 being captured and the distance that the captured CO2 needs to be transported.  There are also few industrial capture projects yet operating, implying uncertainty in addition to the variety of costs.  The CCS cost estimates shown  are based on a range of sources, including recent IEA assessment, https://ieaghg.org/ccs-resources/blog/new-ieaghg-technical-review-towards-improved-guidelines-for-cost-evaluation-of-carbon-capture-and-storage, and estimates from GCCSI https://www.globalccsinstitute.com/wp-content/uploads/2021/03/Technology-Readiness-and-Costs-for-CCS-2021-1.pdf.  The upper end of the range for capture costs is provided by the Longship project, which is likely to be expensive due to project specific factors (transport and storage costs are assumed to be lower than for Longship).

[iii] https://www.theccc.org.uk/wp-content/uploads/2020/12/Sector-summary-Electricity-generation.pdf  See figure M5.4.

Transforming the world’s energy system with solar and wind

Recent analysis confirms the very large increases in solar and wind generation required to decarbonise the energy system by 2050.  Achieving this growth will require large scale investment in grid infrastructure and system balancing.  This is turn will require the right policy support.

An order of magnitude increase in build rates of solar and wind power is needed between now and 2050 …

All informed analysis of decarbonising the world’s energy system shows solar and wind power playing a central role.  For example, recent modelling published by the Energy Transition Commission (ETC)[i] shows electricity meeting around 85% of global energy demand by 2050.  This includes direct electrification and also “indirect electrification”, using hydrogen made by electrolysis, with some of the hydrogen used as ammonia.   Electricity is expected to be mainly from renewables, with nuclear having only a limited role due to high costs and lack of acceptance.  The remainder of the energy mix is expected to be mainly biomass with some use of fossil fuels with CCS.

The analysis emphasises the need for rapid scale up of deployment of renewables, mainly solar and wind (see chart).  In the 2020s the rate of installation of solar and wind must be more than double 2019 levels.  Further increases are required thereafter, reaching more than ten times 2019 rates of installation in the 2040s. The implied compound average growth rate of cumulative installed capacity is approximately 11% p.a. for wind and 13-14% p.a. for solar.  (Note: I published similar analysis in December last year, with largely consistent conclusions.  A comparison is included at the end of this post.)

Chart:  Increase in installation rates for wind and solar

Source:  Energy Transition Commission

Extensive supporting investment will be required to achieve this growth …

This growth in generation appears achievable, although to strong policy drivers will continue to be needed.  However increasing rates of deployment of generation, while essential, are not enough.  A large amount of investment in different types of infrastructure will be needed to make sure that the system balances and electricity is available when required. This includes the following.

  • A mix of renewables – wind, solar and hydro, which have different patterns of production.
  • Increased interconnection to help deal with variation in output from renewables.  For wind, variations within a continent can be large, so links across moderate distances help.  However, with solar, greater resilience may require interconnection over multiple time zones using HVDC (High Voltage Direct Current) transmission lines.  This is because solar output is strongly dependent on time of day, with similar longitudes having correlated output (night is at about the same time). 
  • Dispatchable plant, for example using natural gas with CCS may play some role on systems, although residual and lifecycle emissions will be an issue in many cases.
  • Oversizing the generation relative to peak demand, gives a greater probability of meeting peaks even if output is not at maximum.  This is made easier by falling costs and the availability of storage for surpluses.
  • Demand side flexibility, especially reductions in demand from industry.

However even with these measures in place there will be a substantial need for daily, weekly and seasonal storage.

  • Falling costs of batteries will allow them to play a major role in daily balancing, though likely not over much longer timescales.  There may be a role for batteries in electric vehicles to support grid, but their role remains unclear.
  • Pumped hydro will also help daily and weekly balancing.  Compressed air storage may also play a role.
  • Other hydro will become a very valuable balancing source, for example week to week.
  • Hydrogen generated by electrolysis and then converted back to electricity may have an important role to play both weekly and seasonally.  The ETC analysis shows it as the most cost effective approach for week to week balancing.  It is inefficient due to the losses in conversion of electricity to hydrogen and back again, with a cycle efficiency of only around 35%.  However, this is similar to the efficiency considered normal for coal-fuelled electricity for decades, and should be sustainable if the electricity is cheap enough.  The balance between this and power generation from natural gas with CCS remains unclear, but the relative importance of hydrogen is likely to increase strongly over time.

All this will require large investments.   However with the costs of renewable electricity continuing to fall, renewables should remain cheaper than fossil generation, even allowing for these wider costs. (This excludes the costs of electrifying end use – for example the installation of heat pumps for residential heating will require large capital investments.)

With policy needed to make investment happen …

Making these investments happen will require farsighted regulatory and policy measures to be put in place.  This is partly about removing barriers to infrastructure, such as grids and storage.  In particular building transmission grids at scale is essential, but has too often in the past been a very lengthy processes due in large part to permitting issues.  The inability to build sufficient electricity transmission capacity in Germany has hampered its decarbonisation, for example. But it is also about new commercial arrangements, including electricity pricing and trading arrangements appropriate for a system with a large amount of variable, zero marginal cost capacity. 

What exactly these measures should be I will return to in future posts.  But it is clear that without further measures it will be difficult or impossible for renewable generation can grow at the required rates.  The urgency and scale of action required should not be underestimated 

Adam Whitmore – 15th June 2021

Comparison of modelling

The ETC analysis quoted here has similar assumptions and reaches very similar conclusions to that which I published in a post on this blog late last year, although the two sets of analysis were carried out entirely independently.  A summary comparison is provided in the table below.  Both pieces of modelling envisage somewhat greater electrification than assumed in scenarios by IRENA and BNEF.

AssumptionsThis blog (December 2020)[ii]ETC analysis reported in this post
Total final energy demand in 2050  (000 TWh)102 (sensitivity  127)99 – 137
Percentage electricity of final energy80% (range 70 – 85%)85%*
Electricity consumption in 2050 vs. 2019 (factor higher)3 – 43.5 – 5
Percentage wind and solar of electricity80% (range 70 – 90 %)75 – 90%
Annual installation rate of wind and solar 2020-2050 as a factor of 2019 rates for net zero by 20507 (range 5 – 11)2 to approximately 14, growing over time
Compound annual growth rate of wind and solar installed capacity 2020-205011-12%11% wind, 13-14% solar

* The ETC analysis shows electrification comprising 68% direct electrification, 15% electrolytic hydrogen and about 2% ammonia. My analysis did not separate out direct electrification, hydrogen from electrolysis, and ammonia from hydrogen. 


[i] https://www.energy-transitions.org/publications/making-clean-electricity-possible/

[ii] https://onclimatechangepolicydotorg.wordpress.com/2020/12/14/a-further-huge-scale-up-of-solar-and-wind-power-is-needed/