The IEA’s projections for wind and solar capacity look much too low, continuing a history of vastly underestimating renewables growth. Their projections are not a reliable basis for projecting the world’s future power generation mix.
I previously looked at the IEA’s track record of underestimating the growth of renewables by a huge margin. Since then the 2013 and 2014 World Energy Outlooks have been published, and it seems timely to ask how the credibility of their outlook has improved. The answer appears, regrettably, to be “not much”.
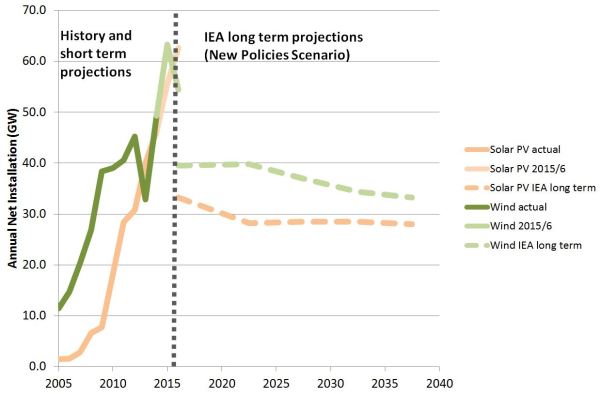
The chart below shows the IEA’s long term projections for global capacity additions of wind and solar PV, taken from the current version of its central New Policies Scenario, and compares these with historical growth and short term projections. The short term projections are likely to be quite accurate, especially for wind, as projects due on this year or next are usually already in progress.
Annual net global installations of wind and solar: comparison of IEA long term projections (New Policies Scenario) with historical data (to 2014) and short term projections (2015-6)
Notes: Historical data is from BP, the Global Wind Energy Council and Bloomberg. Short term projections are from Bloomberg, as of February 2015. Long term projections are from the IEA World Energy Outlook, 2014, New Policies Scenario. IEA projections are for 2012-2020 and for each 5 years thereafter, and are shown at the mid-point of each interval. (The original post contained a minor plotting error for some of the historic data, now corrected. The change reinforces the story as it correctly emphasises further the rapid growth of solar.)
The historic and short term forecast data shows a clear and strong upward trend in the rate of capacity installation for both technologies, although for wind this has somewhat moderated in recent years, and there has been considerable year to year policy-driven volatility.
The IEA’s projections show a sharp reversal of this trend, with net installation rates falling to well below current levels, and staying there or falling further for the next two and a half decades. The average annual installation rate projected by the IEA over the period 2020-2040 is nearly 30% below last year’s outturn for wind, and nearly 40% below what’s likely to be put in this year. For solar PV the decrease is even greater, with projected installation rates 40% below last year’s outturn, and nearly 50% below what’s likely this year. This implies a substantial contraction in the wind and solar PV industries from their present size, rather than continuing growth or stabilisation. The IEA projects correspondingly small proportions of the world’s electricity generation coming from wind and solar PV. Even a quarter century from now their projections show wind accounting for only 8.3% of generation (in TWh) and solar PV a mere 3.2%.
It may well be that renewables installation rates begin to grow more slowly and even eventually plateau as markets mature. But a sudden fall by around a third or a half of current levels sustained into the long term seems to run against the main prevailing drivers.
The imperative to reduce carbon emissions from power generation is ever greater. This looks likely to continue to be a strong driver for renewables growth through direct mandates for renewables and (especially in the long term) through incentives from carbon pricing. Renewables are also highly compatible with other policy objectives such as security of energy supply.
Renewables are much more cost competitive than they were, both with other low carbon generation and with conventional fossil fuels, especially if fossil generation includes the cost of its emissions. Costs for wind and especially solar are expected to continue to fall.
Some argue that the total subsidy needed by solar and wind will limit their growth. However as costs fall any remaining subsidies required will continue to fall even faster in percentage terms (so for example a 20% decrease in costs may lead to a 50% decrease in required subsidy). This is likely to limit the total additional costs of renewables even as volumes grow, and especially in the 2020s and 2030s as the proportion of projects requiring no subsidy grows ever greater.
There is also scope to increase the installed base of renewables globally to well above the levels projected by the IEA without causing significant problems for grid integration. In any case such obstacles are likely to reduce over time with improved grid management, greater interconnection, and falling costs of batteries.
Given these drivers the IEA’s projections appear to be close to or below the bottom end of the credible range for rates of deployment, especially for solar, rather than the central case they are intended to represent. They do not form a reliable basis for assessing the future of the world’s power generation mix.
Adam Whitmore – 27th February 2015

Pingback: Why have the IEA’s projections of renewables growth been so much lower than the out-turn? | On Climate Change Policy
Pingback: The IEA’s Bridge Scenario to a low carbon world again underestimates the role of renewables | On Climate Change Policy
Pingback: Underestimating the contribution of solar PV risks damaging policy making | On Climate Change Policy
Pingback: The IEA’s solar PV projections are more misleading than ever | On Climate Change Policy